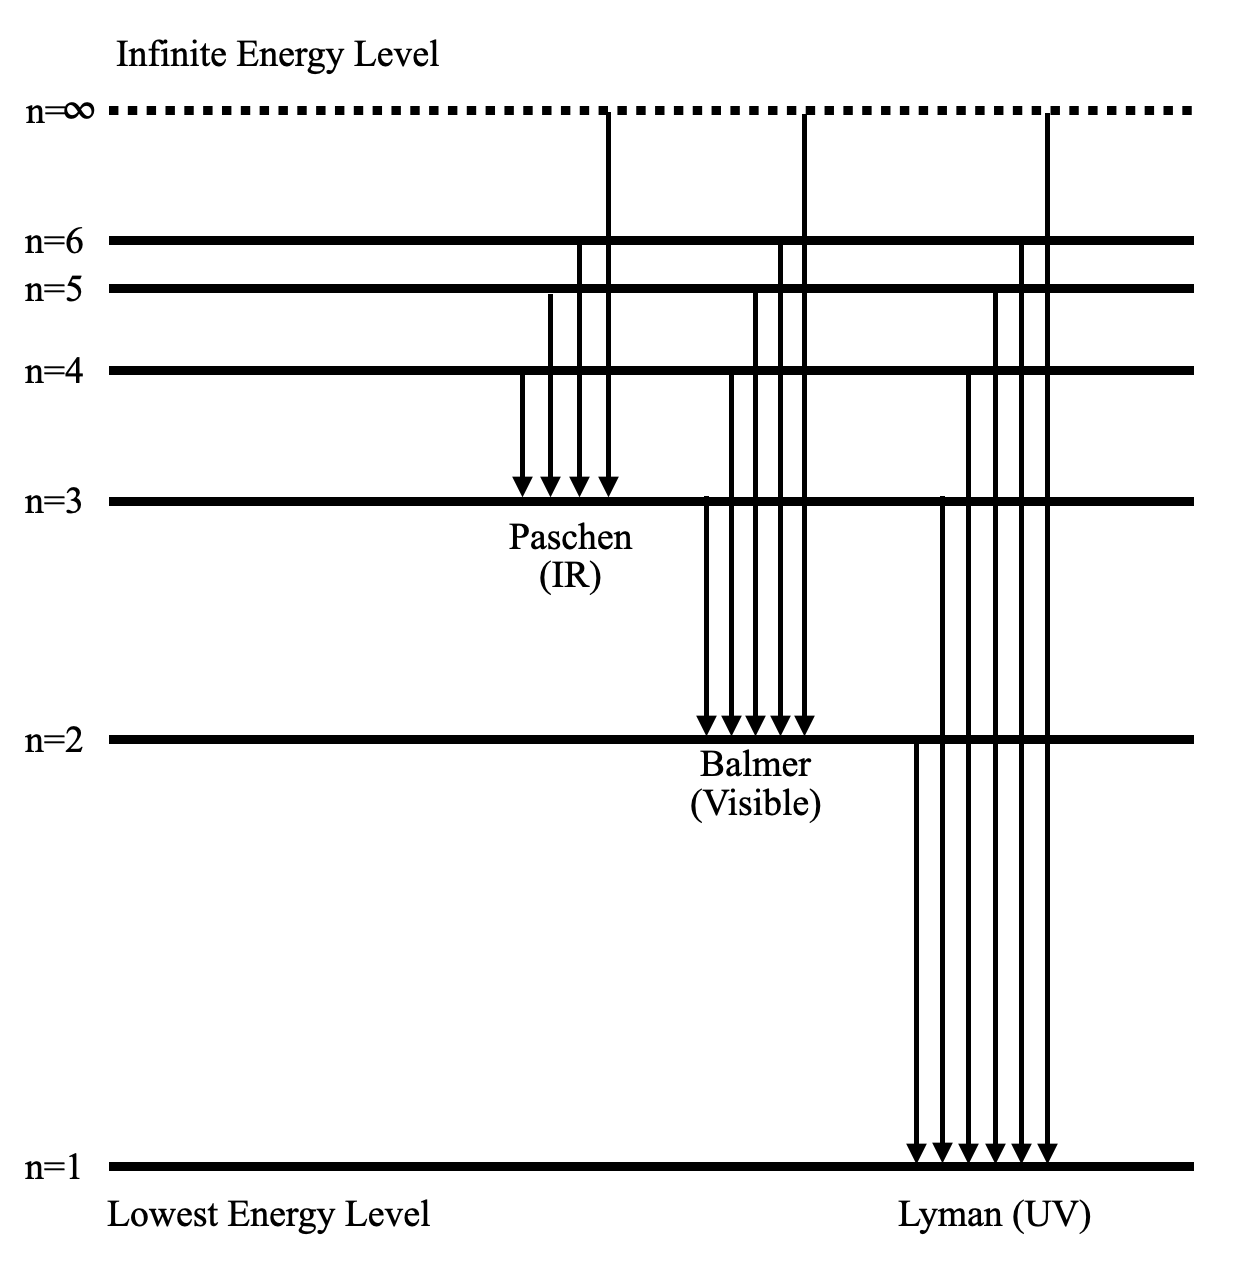
Draw a neat labelled energy level diagram of the Hydrogen atom.
Answer
598.8k+ views
Hint: Energy level diagram is the direct consequence of the principal quantum number - ‘n’. Energy diagram is necessary to determine the energy difference between two states and explain the hydrogen spectrum.
Complete step-by-step answer:
The following diagram shows the energy level diagram of the Hydrogen atom.

A Hydrogen atom has only one single electron revolving around the nucleus at the lowest energy level. When we heat a hydrogen atom, the electron gains energy and moves up to higher energy levels.
When the electron loses its energy, it jumps from one energy level to the other. In this process, the difference in potential energy is observed in the form of electromagnetic radiation.
Depending on the energy difference of the respective jumps, the wavelength of the light wave also varies. So, we have several series which denote the jumps. For example, if any electron comes down to the lowest energy level (n=1), then the series is called the Lyman series. The wavelength of the light stays in the UV region of the electromagnetic waves.
Similarly, if an electron goes down to n=2 from an excited state, the released light wave stays in the visible region. This is called the Balmer series.
As you have probably guessed, there are only a few specific values of wavelengths possible for these discrete jumps. Hence, the released spectrum isn’t continuous. This is the experiment which is responsible for Bohr’s atomic model.
Note:
The infinite energy level is the state where the electron is free from the attraction of the nucleus. So, the potential energy at that state is zero. As we move towards the nucleus, the potential energy becomes negative. So, the electron is most stable at the lowest energy level.
Complete step-by-step answer:
The following diagram shows the energy level diagram of the Hydrogen atom.

A Hydrogen atom has only one single electron revolving around the nucleus at the lowest energy level. When we heat a hydrogen atom, the electron gains energy and moves up to higher energy levels.
When the electron loses its energy, it jumps from one energy level to the other. In this process, the difference in potential energy is observed in the form of electromagnetic radiation.
Depending on the energy difference of the respective jumps, the wavelength of the light wave also varies. So, we have several series which denote the jumps. For example, if any electron comes down to the lowest energy level (n=1), then the series is called the Lyman series. The wavelength of the light stays in the UV region of the electromagnetic waves.
Similarly, if an electron goes down to n=2 from an excited state, the released light wave stays in the visible region. This is called the Balmer series.
As you have probably guessed, there are only a few specific values of wavelengths possible for these discrete jumps. Hence, the released spectrum isn’t continuous. This is the experiment which is responsible for Bohr’s atomic model.
Note:
The infinite energy level is the state where the electron is free from the attraction of the nucleus. So, the potential energy at that state is zero. As we move towards the nucleus, the potential energy becomes negative. So, the electron is most stable at the lowest energy level.
Recently Updated Pages
Master Class 12 Economics: Engaging Questions & Answers for Success

Master Class 12 Physics: Engaging Questions & Answers for Success

Master Class 12 English: Engaging Questions & Answers for Success

Master Class 12 Social Science: Engaging Questions & Answers for Success

Master Class 12 Maths: Engaging Questions & Answers for Success

Master Class 12 Business Studies: Engaging Questions & Answers for Success

Trending doubts
Which are the Top 10 Largest Countries of the World?

What are the major means of transport Explain each class 12 social science CBSE

Draw a labelled sketch of the human eye class 12 physics CBSE

Why cannot DNA pass through cell membranes class 12 biology CBSE

Differentiate between insitu conservation and exsitu class 12 biology CBSE

Draw a neat and well labeled diagram of TS of ovary class 12 biology CBSE


