


Draw a pie chart of the data given below.
Time spent for Sleep School Play Others Time spent 8 hours 6 hours 2 hours 8 hours
| Time spent for | Sleep | School | Play | Others |
| Time spent | 8 hours | 6 hours | 2 hours | 8 hours |
Answer
593.1k+ views
Hint: Here, we are provided by the number of hours spent on different activities and pie chart can be easily made by measuring the angle of sectors and plotting them inside a circle whose collective sum of angle is equals to $ {{360}^{{}^\circ }} $
Complete step-by-step answer:
In question, it is asked to draw a pie chart of data given in the table below which shows the time spent on various activities such as 8 hours are spent on sleep, 6 hours are spent on school, 2 hours are spent on play and 8 hours are spent on other activities.
Now, pie chart is a circular pictorial representation on which data is shown by the different size of sectors which collectively makes a circle and the sum of angles of all sectors is equal to $ {{360}^{{}^\circ }} $ .
Now, to make a pie chart first step is to find out how much degree a sector is acquiring for each activity which can be find out by simple formula which is value of activity to the values of all activity put together multiplied by $ {{360}^{{}^\circ }} $ that is $ \dfrac{\text{value of activity}}{\text{values of all activity put together}}\text{ }\!\!\times\!\!\text{ 36}{{\text{0}}^{\text{ }\!\!{}^\circ\!\!\text{ }}} $ .
Now total hours spent is equal to sum of all hours spent on sleep, school, play and other activities.
So, Total Hours = 8 + 6 + 2 + 8 = 24 hours
So, Angle of the sector representing sleep $ =\dfrac{8}{24}\text{ }\!\!\times\!\!\text{ 36}{{\text{0}}^{\text{ }\!\!{}^\circ\!\!\text{ }}} $
On simplifying , Angle of sector representing sleep $ =\dfrac{1}{3}\text{ }\!\!\times\!\!\text{ 36}{{\text{0}}^{\text{ }\!\!{}^\circ\!\!\text{ }}}={{120}^{{}^\circ }} $
Angle of sector representing sleep $ =\dfrac{6}{24}\text{ }\!\!\times\!\!\text{ 36}{{\text{0}}^{\text{ }\!\!{}^\circ\!\!\text{ }}} $
On simplifying , Angle of sector representing school $ =\dfrac{1}{4}\text{ }\!\!\times\!\!\text{ 36}{{\text{0}}^{\text{ }\!\!{}^\circ\!\!\text{ }}}={{90}^{{}^\circ }} $
Angle of sector representing play $ =\dfrac{2}{24}\text{ }\!\!\times\!\!\text{ 36}{{\text{0}}^{\text{ }\!\!{}^\circ\!\!\text{ }}} $
On simplifying , Angle of sector representing sleep $ =\dfrac{1}{12}\text{ }\!\!\times\!\!\text{ 36}{{\text{0}}^{\text{ }\!\!{}^\circ\!\!\text{ }}}={{30}^{{}^\circ }} $
Angle of sector representing sleep $ =\dfrac{8}{24}\text{ }\!\!\times\!\!\text{ 36}{{\text{0}}^{\text{ }\!\!{}^\circ\!\!\text{ }}} $
On simplifying , Angle of sector representing others $ =\dfrac{1}{3}\text{ }\!\!\times\!\!\text{ 36}{{\text{0}}^{\text{ }\!\!{}^\circ\!\!\text{ }}}={{120}^{{}^\circ }} $
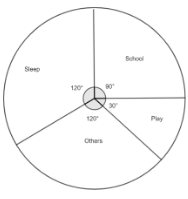
So, pie chart representing the table data will be of form,
Note: Total activity time should be measured properly as it will change the value of measure and hence pie charts will be formed wrong. Pie charts should be neat and visible and should be properly labelled.
Complete step-by-step answer:
In question, it is asked to draw a pie chart of data given in the table below which shows the time spent on various activities such as 8 hours are spent on sleep, 6 hours are spent on school, 2 hours are spent on play and 8 hours are spent on other activities.
Now, pie chart is a circular pictorial representation on which data is shown by the different size of sectors which collectively makes a circle and the sum of angles of all sectors is equal to $ {{360}^{{}^\circ }} $ .
Now, to make a pie chart first step is to find out how much degree a sector is acquiring for each activity which can be find out by simple formula which is value of activity to the values of all activity put together multiplied by $ {{360}^{{}^\circ }} $ that is $ \dfrac{\text{value of activity}}{\text{values of all activity put together}}\text{ }\!\!\times\!\!\text{ 36}{{\text{0}}^{\text{ }\!\!{}^\circ\!\!\text{ }}} $ .
Now total hours spent is equal to sum of all hours spent on sleep, school, play and other activities.
So, Total Hours = 8 + 6 + 2 + 8 = 24 hours
So, Angle of the sector representing sleep $ =\dfrac{8}{24}\text{ }\!\!\times\!\!\text{ 36}{{\text{0}}^{\text{ }\!\!{}^\circ\!\!\text{ }}} $
On simplifying , Angle of sector representing sleep $ =\dfrac{1}{3}\text{ }\!\!\times\!\!\text{ 36}{{\text{0}}^{\text{ }\!\!{}^\circ\!\!\text{ }}}={{120}^{{}^\circ }} $
Angle of sector representing sleep $ =\dfrac{6}{24}\text{ }\!\!\times\!\!\text{ 36}{{\text{0}}^{\text{ }\!\!{}^\circ\!\!\text{ }}} $
On simplifying , Angle of sector representing school $ =\dfrac{1}{4}\text{ }\!\!\times\!\!\text{ 36}{{\text{0}}^{\text{ }\!\!{}^\circ\!\!\text{ }}}={{90}^{{}^\circ }} $
Angle of sector representing play $ =\dfrac{2}{24}\text{ }\!\!\times\!\!\text{ 36}{{\text{0}}^{\text{ }\!\!{}^\circ\!\!\text{ }}} $
On simplifying , Angle of sector representing sleep $ =\dfrac{1}{12}\text{ }\!\!\times\!\!\text{ 36}{{\text{0}}^{\text{ }\!\!{}^\circ\!\!\text{ }}}={{30}^{{}^\circ }} $
Angle of sector representing sleep $ =\dfrac{8}{24}\text{ }\!\!\times\!\!\text{ 36}{{\text{0}}^{\text{ }\!\!{}^\circ\!\!\text{ }}} $
On simplifying , Angle of sector representing others $ =\dfrac{1}{3}\text{ }\!\!\times\!\!\text{ 36}{{\text{0}}^{\text{ }\!\!{}^\circ\!\!\text{ }}}={{120}^{{}^\circ }} $
So, pie chart representing the table data will be of form,
Note: Total activity time should be measured properly as it will change the value of measure and hence pie charts will be formed wrong. Pie charts should be neat and visible and should be properly labelled.
Recently Updated Pages
Master Class 9 General Knowledge: Engaging Questions & Answers for Success
Master Class 9 Social Science: Engaging Questions & Answers for Success
Master Class 9 English: Engaging Questions & Answers for Success
Master Class 9 Maths: Engaging Questions & Answers for Success
Master Class 9 Science: Engaging Questions & Answers for Success
Class 9 Question and Answer - Your Ultimate Solutions Guide
Trending doubts
Difference Between Plant Cell and Animal Cell
Fill the blanks with the suitable prepositions 1 The class 9 english CBSE
Who is eligible for RTE class 9 social science CBSE
Which places in India experience sunrise first and class 9 social science CBSE
What is pollution? How many types of pollution? Define it
Name 10 Living and Non living things class 9 biology CBSE