


Draw a standard ECG and explain the different segments in it.
Answer
558k+ views
Hint: ECG stands for Electrocardiogram. Dutch physiologist Willem Einthoven developed the first electrocardiogram in 1903. It is a graphic tracing of the electrical impulses generated by the muscles of the heart during a heartbeat.
Complete answer:
The electrical impulses produced by the heart are recorded by the electrocardiograph. It provides information regarding the condition and performance of the heart.
Segments of the electrocardiogram-
1. The normal ECG graph shows upward and downward deflections that shows the alternate contraction of upper two chambers and the lower two chambers called the auricles and the ventricles.
2. The atrial contraction leads to first upward deflection called the “P” called the atrial complex.
3. The action of ventricles leads to deflections “Q, R, S, T” called the ventricular complexes.
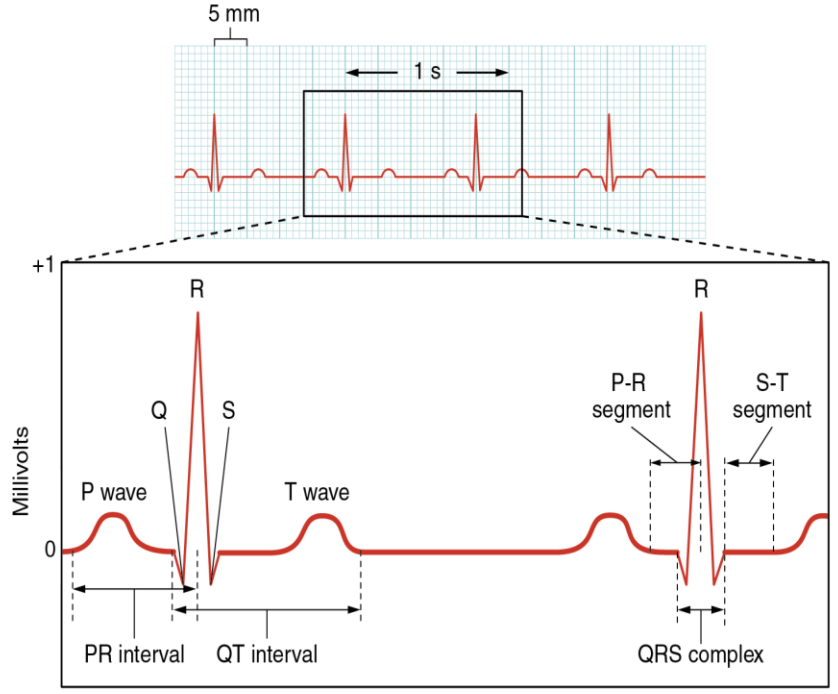
4. Any deviation from the normal pattern in ECG graph indicates heart disorders.
5. The normal PR interval is 120- 200 milliseconds.
6. The normal QT interval is 400-440 milliseconds.
7. The prolonged QT interval leads to lower heart rates.
Uses of Electrocardiogram:
- It is used to diagnose cardiac arrhythmias, myocardial infarctions, pericardial disease, and cardiac enlargement.
- Hypertension, thyroid disease and certain malnutrition can also be diagnosed by ECG.
- It is also used to diagnose a heart blockage.
Note: Electrocardiograms are generated by applying electrodes in different parts of the body including the limbs, chest. These electrodes record the electrical activity of the heart. The ECGs are standardised so that they can be compared from person to person.
Complete answer:
The electrical impulses produced by the heart are recorded by the electrocardiograph. It provides information regarding the condition and performance of the heart.
Segments of the electrocardiogram-
1. The normal ECG graph shows upward and downward deflections that shows the alternate contraction of upper two chambers and the lower two chambers called the auricles and the ventricles.
2. The atrial contraction leads to first upward deflection called the “P” called the atrial complex.
3. The action of ventricles leads to deflections “Q, R, S, T” called the ventricular complexes.
4. Any deviation from the normal pattern in ECG graph indicates heart disorders.
5. The normal PR interval is 120- 200 milliseconds.
6. The normal QT interval is 400-440 milliseconds.
7. The prolonged QT interval leads to lower heart rates.
Uses of Electrocardiogram:
- It is used to diagnose cardiac arrhythmias, myocardial infarctions, pericardial disease, and cardiac enlargement.
- Hypertension, thyroid disease and certain malnutrition can also be diagnosed by ECG.
- It is also used to diagnose a heart blockage.
Note: Electrocardiograms are generated by applying electrodes in different parts of the body including the limbs, chest. These electrodes record the electrical activity of the heart. The ECGs are standardised so that they can be compared from person to person.
Recently Updated Pages
Master Class 10 Computer Science: Engaging Questions & Answers for Success
Master Class 10 General Knowledge: Engaging Questions & Answers for Success
Master Class 10 English: Engaging Questions & Answers for Success
Master Class 10 Social Science: Engaging Questions & Answers for Success
Master Class 10 Maths: Engaging Questions & Answers for Success
Master Class 10 Science: Engaging Questions & Answers for Success
Trending doubts
What is the median of the first 10 natural numbers class 10 maths CBSE
Which women's tennis player has 24 Grand Slam singles titles?
Who is the Brand Ambassador of Incredible India?
Why is there a time difference of about 5 hours between class 10 social science CBSE
Write a letter to the principal requesting him to grant class 10 english CBSE
State and prove converse of BPT Basic Proportionality class 10 maths CBSE