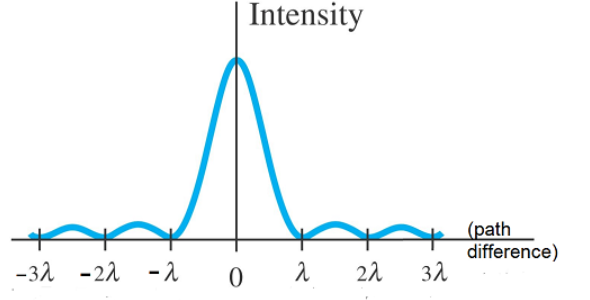
Draw the curve for intensity distribution by single slit.
Answer
584.1k+ views
Hint: We obtain the curve for intensity distribution of light by single slit due to diffraction. When light passes through a single silt, we get a central bright band with alternative bright and dark bands of decreasing intensities.
Complete answer:
Let us first understand what is meant by diffraction of light.
The phenomenon of bending of light around the corners of an obstacle of size comparable to the wavelength of light, such as the edge of a slit or sharp aperture is called diffraction of light.
We know that light sometimes acts as a particle and sometimes acts as a wave. The phenomenon of diffraction can be explained by considering the light as a wave.
That is why you do not see the complete dark of an object. Light diffracts at the edges of the object and due to this the shadow appears to be fading near the edges.
When light passes through a single slit whose size is comparable to the wavelength of light, the light undergoes diffraction.
Let us discuss the intensity distribution obtained on a screen placed far away from the slit.
In this case, we get a central bright band (maximum intensity) with alternative bright and dark (minimum intensity) bands of decreasing intensities as shown below:

Note:
Always remember that light will undergo diffraction only when the size of the obstacle is comparable to the wavelength of light.
The degree of diffraction depends on the wavelength of light. Greater the wavelength of light, higher will be the degree of diffraction.
Complete answer:
Let us first understand what is meant by diffraction of light.
The phenomenon of bending of light around the corners of an obstacle of size comparable to the wavelength of light, such as the edge of a slit or sharp aperture is called diffraction of light.
We know that light sometimes acts as a particle and sometimes acts as a wave. The phenomenon of diffraction can be explained by considering the light as a wave.
That is why you do not see the complete dark of an object. Light diffracts at the edges of the object and due to this the shadow appears to be fading near the edges.
When light passes through a single slit whose size is comparable to the wavelength of light, the light undergoes diffraction.
Let us discuss the intensity distribution obtained on a screen placed far away from the slit.
In this case, we get a central bright band (maximum intensity) with alternative bright and dark (minimum intensity) bands of decreasing intensities as shown below:

Note:
Always remember that light will undergo diffraction only when the size of the obstacle is comparable to the wavelength of light.
The degree of diffraction depends on the wavelength of light. Greater the wavelength of light, higher will be the degree of diffraction.
Recently Updated Pages
Master Class 12 Economics: Engaging Questions & Answers for Success

Master Class 12 Physics: Engaging Questions & Answers for Success

Master Class 12 English: Engaging Questions & Answers for Success

Master Class 12 Social Science: Engaging Questions & Answers for Success

Master Class 12 Maths: Engaging Questions & Answers for Success

Master Class 12 Business Studies: Engaging Questions & Answers for Success

Trending doubts
Which are the Top 10 Largest Countries of the World?

What are the major means of transport Explain each class 12 social science CBSE

Draw a labelled sketch of the human eye class 12 physics CBSE

Why cannot DNA pass through cell membranes class 12 biology CBSE

Differentiate between insitu conservation and exsitu class 12 biology CBSE

Draw a neat and well labeled diagram of TS of ovary class 12 biology CBSE


