


Draw the graph for the linear equation given \[x + 3 = 0\].
Answer
565.2k+ views
Hint: For drawing any graph we need \[x\] and \[y\] values. But in any case, if one of them is not given then we will assume that value and after that, we will be drawing the graph by calculating the values from the given expression.
For example, if in the expression \[y = 2\], we don’t have the value of \[x\], so by assuming three or four values of \[y\] we get the points as below:
\[\left( {0,2} \right)\],
\[\left( { - 1,2} \right)\],
\[\left( {1,2} \right)\]
Complete step-by-step answer:
Step 1: In the given expression \[x + 3 = 0\], we will be calculating the value of \[x\] as shown below:
\[x + 3 = 0\]
By bringing \[3\] into the RHS side of the expression we get:
\[ \Rightarrow x = - 3\]
Step 2: Now, as we can see there is no specified value \[y\] here so we can take any values \[y\] for drawing the graph. The table is as shown below consisting of the values of
\[x\] and \[y\]:
Step 3: Plotting the graph by using the above table:
Note:
Students need to calculate the coordinates for both \[x\] and \[y\] axis. If any of them is not given then assume any value which comes in the straight line of that axis and draw a graph by joining the points.
For example, if in the expression \[y = 2\], we don’t have the value of \[x\], so by assuming three or four values of \[y\] we get the points as below:
\[\left( {0,2} \right)\],
\[\left( { - 1,2} \right)\],
\[\left( {1,2} \right)\]
Complete step-by-step answer:
Step 1: In the given expression \[x + 3 = 0\], we will be calculating the value of \[x\] as shown below:
\[x + 3 = 0\]
By bringing \[3\] into the RHS side of the expression we get:
\[ \Rightarrow x = - 3\]
Step 2: Now, as we can see there is no specified value \[y\] here so we can take any values \[y\] for drawing the graph. The table is as shown below consisting of the values of
\[x\] and \[y\]:
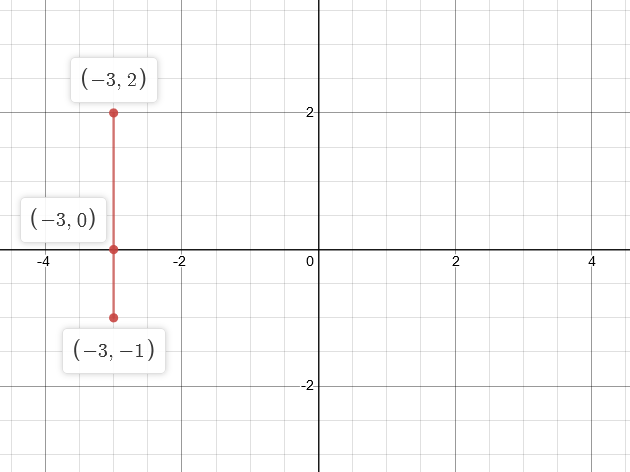
| \[x\] | \[ - 3\] | \[ - 3\] | \[ - 3\] |
| \[y\] | \[ - 1\] | \[0\] | \[1\] |
Step 3: Plotting the graph by using the above table:
Note:
Students need to calculate the coordinates for both \[x\] and \[y\] axis. If any of them is not given then assume any value which comes in the straight line of that axis and draw a graph by joining the points.
Recently Updated Pages
Master Class 10 Computer Science: Engaging Questions & Answers for Success
Master Class 10 General Knowledge: Engaging Questions & Answers for Success
Master Class 10 English: Engaging Questions & Answers for Success
Master Class 10 Social Science: Engaging Questions & Answers for Success
Master Class 10 Maths: Engaging Questions & Answers for Success
Master Class 10 Science: Engaging Questions & Answers for Success
Trending doubts
What is the median of the first 10 natural numbers class 10 maths CBSE
Which women's tennis player has 24 Grand Slam singles titles?
Who is the Brand Ambassador of Incredible India?
Why is there a time difference of about 5 hours between class 10 social science CBSE
Write a letter to the principal requesting him to grant class 10 english CBSE
State and prove converse of BPT Basic Proportionality class 10 maths CBSE