


Draw the graph of an inverse trigonometric function?
Answer
559.8k+ views
Hint: Given an inverse trig function. We have to plot the inverse trigonometric function such as arcsine, arccosine, arctangent etc. functions. The graph of inverse trig function is plotted by switching the values of x and y variables. Also, the graph of the inverse trig function is symmetrical around the line with equation $y = x$.
Complete step by step answer:
First we will plot the graph of the trigonometric function $y = \sin x$ by finding the value of $y$for different values of $x$.
For \[x = - \dfrac{\pi }{2}\], find the value of $y$.
$ \Rightarrow y = \sin \left( { - \dfrac{\pi }{2}} \right)$
Apply the identity $\sin \left( { - x} \right) = - \sin x$ to the expression.
$ \Rightarrow y = - \sin \left( {\dfrac{\pi }{2}} \right)$
Substitute the value of $\sin \left( {\dfrac{\pi }{2}} \right) = 1$ into the expression.
$ \Rightarrow y = - 1$
For \[x = 0\], find the value of $y$.
$ \Rightarrow y = \sin 0$
Substitute the value of $\sin 0 = 0$ into the expression.
$ \Rightarrow y = 0$
For \[x = \dfrac{\pi }{2}\], find the value of $y$.
$ \Rightarrow y = \sin \left( {\dfrac{\pi }{2}} \right)$
Substitute the value of $\sin \left( {\dfrac{\pi }{2}} \right) = 1$ into the expression.
$ \Rightarrow y = 1$
Now, write the values of $y$ for different values of $x$ in tabular form.
Now, draw the graph of $y = \sin x$ by plotting the coordinates \[\left( {x,y} \right)\] on the set of x and y axis and join them.
Now, compute the value of \[\left( {x,y} \right)\] for the graph of inverse trig function $y = {\sin ^{ - 1}}x$ by switching the values of x and y.
Now, draw the graph of $y = {\sin ^{ - 1}}x$ by plotting the coordinates \[\left( {x,y} \right)\] on the set of x and y axis and join them
Note: In such types of questions students mainly do mistakes while plotting the points on the set of axes. In an ordered pair $\left( {x,y} \right)$, the value of $x$ is the distance of the point from $y$-axis whereas the value of $y$ is plotted by taking the distance from the $x$-axis. In such types of questions, the graph of function is obtained by plotting these points.
Complete step by step answer:
First we will plot the graph of the trigonometric function $y = \sin x$ by finding the value of $y$for different values of $x$.
For \[x = - \dfrac{\pi }{2}\], find the value of $y$.
$ \Rightarrow y = \sin \left( { - \dfrac{\pi }{2}} \right)$
Apply the identity $\sin \left( { - x} \right) = - \sin x$ to the expression.
$ \Rightarrow y = - \sin \left( {\dfrac{\pi }{2}} \right)$
Substitute the value of $\sin \left( {\dfrac{\pi }{2}} \right) = 1$ into the expression.
$ \Rightarrow y = - 1$
For \[x = 0\], find the value of $y$.
$ \Rightarrow y = \sin 0$
Substitute the value of $\sin 0 = 0$ into the expression.
$ \Rightarrow y = 0$
For \[x = \dfrac{\pi }{2}\], find the value of $y$.
$ \Rightarrow y = \sin \left( {\dfrac{\pi }{2}} \right)$
Substitute the value of $\sin \left( {\dfrac{\pi }{2}} \right) = 1$ into the expression.
$ \Rightarrow y = 1$
Now, write the values of $y$ for different values of $x$ in tabular form.
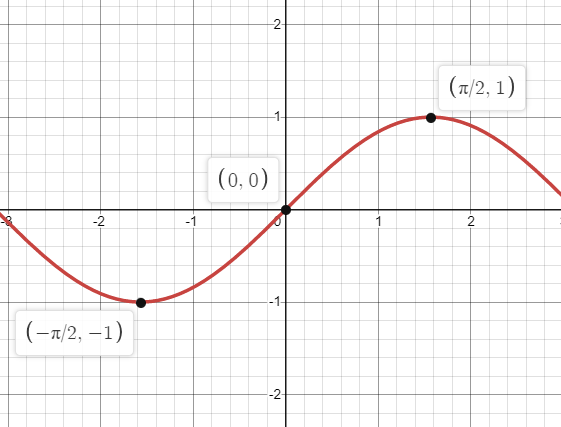
| $x$ | \[ - \dfrac{\pi }{2}\] | $0$ | \[\dfrac{\pi }{2}\] |
| $y$ | $ - 1$ | $0$ | $1$ |
Now, draw the graph of $y = \sin x$ by plotting the coordinates \[\left( {x,y} \right)\] on the set of x and y axis and join them.
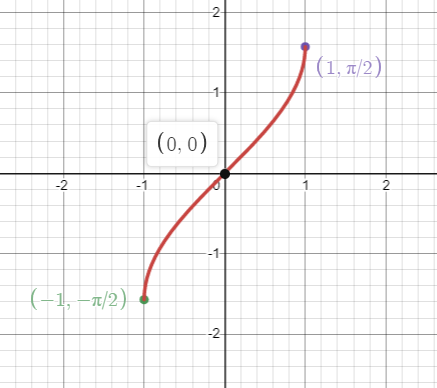
Now, compute the value of \[\left( {x,y} \right)\] for the graph of inverse trig function $y = {\sin ^{ - 1}}x$ by switching the values of x and y.
| $x$ | $ - 1$ | $0$ | $1$ |
| $y$ | \[ - \dfrac{\pi }{2}\] | $0$ | \[\dfrac{\pi }{2}\] |
Now, draw the graph of $y = {\sin ^{ - 1}}x$ by plotting the coordinates \[\left( {x,y} \right)\] on the set of x and y axis and join them
Note: In such types of questions students mainly do mistakes while plotting the points on the set of axes. In an ordered pair $\left( {x,y} \right)$, the value of $x$ is the distance of the point from $y$-axis whereas the value of $y$ is plotted by taking the distance from the $x$-axis. In such types of questions, the graph of function is obtained by plotting these points.
Recently Updated Pages
Master Class 12 Economics: Engaging Questions & Answers for Success
Master Class 12 Physics: Engaging Questions & Answers for Success
Master Class 12 English: Engaging Questions & Answers for Success
Master Class 12 Social Science: Engaging Questions & Answers for Success
Master Class 12 Maths: Engaging Questions & Answers for Success
Master Class 12 Business Studies: Engaging Questions & Answers for Success
Trending doubts
Which are the Top 10 Largest Countries of the World?
What are the major means of transport Explain each class 12 social science CBSE
Draw a labelled sketch of the human eye class 12 physics CBSE
Why cannot DNA pass through cell membranes class 12 biology CBSE
Differentiate between insitu conservation and exsitu class 12 biology CBSE
Draw a neat and well labeled diagram of TS of ovary class 12 biology CBSE