


Draw the graph of the straight line x=4.
Answer
585.9k+ views
Hint: A graph is a mathematical representation of a network, and it describes the relationship between lines and points. It is a diagram showing the relation between two or more things. There are four most common graphs, which are known as line graphs, bar graphs, histograms and Cartesian graphs.
Complete step-by-step answer:
To draw a graph of a line first, we need to know the equation of the line, and then their coordinates for x and y-axis are found from the line equation which is to be represented on the graph. The general equation of a graph is given by the equation\[y = mx + c\], where m represents the slope of the line and c is the y-intercept and this equation the coordinates of the y-axis is found by substituting any values of x and this method is repeated for different values x which is then plotted on the graph.
Given the equation of the straight line\[x = 4\]or this can be written as \[x - 4 = 0\]
By comparing this equation with the equation of the straight line, we n say there is no y-intercept, and the slope of the line is also undefined since \[m = 0\]
The line \[x = 4\]has its coordinate fixed at \[\left( {4,0} \right)\]and its coordinate is varying, hence by plotting the graph we get
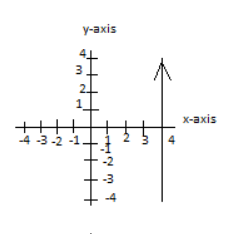
Hence we get the graph for the straight line x=4.
Note: Students must note that whenever any of the axis weather x-axis or the y-axis is zero, the line is a continuous line moving in a positive or negative direction.
Complete step-by-step answer:
To draw a graph of a line first, we need to know the equation of the line, and then their coordinates for x and y-axis are found from the line equation which is to be represented on the graph. The general equation of a graph is given by the equation\[y = mx + c\], where m represents the slope of the line and c is the y-intercept and this equation the coordinates of the y-axis is found by substituting any values of x and this method is repeated for different values x which is then plotted on the graph.
Given the equation of the straight line\[x = 4\]or this can be written as \[x - 4 = 0\]
By comparing this equation with the equation of the straight line, we n say there is no y-intercept, and the slope of the line is also undefined since \[m = 0\]
The line \[x = 4\]has its coordinate fixed at \[\left( {4,0} \right)\]and its coordinate is varying, hence by plotting the graph we get
Hence we get the graph for the straight line x=4.
Note: Students must note that whenever any of the axis weather x-axis or the y-axis is zero, the line is a continuous line moving in a positive or negative direction.
Recently Updated Pages
Master Class 9 General Knowledge: Engaging Questions & Answers for Success
Master Class 9 Social Science: Engaging Questions & Answers for Success
Master Class 9 English: Engaging Questions & Answers for Success
Master Class 9 Maths: Engaging Questions & Answers for Success
Master Class 9 Science: Engaging Questions & Answers for Success
Class 9 Question and Answer - Your Ultimate Solutions Guide
Trending doubts
Difference Between Plant Cell and Animal Cell
Fill the blanks with the suitable prepositions 1 The class 9 english CBSE
Who is eligible for RTE class 9 social science CBSE
Which places in India experience sunrise first and class 9 social science CBSE
What is pollution? How many types of pollution? Define it
Name 10 Living and Non living things class 9 biology CBSE