


Draw the histogram of the weekly pocket expenses of 125 students of a school given below. \[\]
Weekly Expenses (In Rs) No. Of students 10-20 10 20-30 15 30-50 40 50-60 25 60-90 30 90-100 5
| Weekly Expenses (In Rs) | No. Of students |
| 10-20 | 10 |
| 20-30 | 15 |
| 30-50 | 40 |
| 50-60 | 25 |
| 60-90 | 30 |
| 90-100 | 5 |
Answer
520.7k+ views
Hint: We find the width of each bin of weekly expenses by subtracting the lower limit of the bin from the upper limit as10, 10, 20, 10, 30, and 10. The frequency is the number of students in each bin which are 10, 15, 40, and 25,30,5. We draw vertical bars with width equal to width of the bins and the height equal to the corresponding frequency of the bin.
Complete step by step answer:
We know that histogram is an approximate representation of distribution of numerical data. We need a range of values called bins or intervals and the number of items that fall into a particular bin also called frequency. The bins have to be continuous, non-overlapping and most of the time equal. . \[\]
The histogram consists of adjacent vertical rectangular bars on the horizontal axis whose width is proportional to the width of the bin and height is proportional to corresponding frequency of the bin frequencies. \[\]
Let us observe the given table of the weekly pocket expenses of 125 students of a school from the question. . \[\]
We are given 7 bins of weekly expenses in rupees and their corresponding frequencies as the number of students. We see that the bins are not of equal width for example the width of first bin from the top is $20-10=10$ , the width of third bin is $50-30=20$ and the width of fifth bin is $90-60=30.$ . \[\]
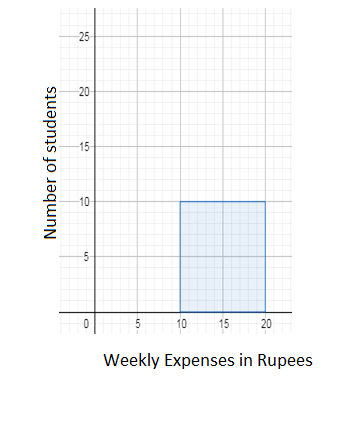
Let us draw the first rectangular bar for the bin 10-20 whose width is $20-10=10$ and its frequency is 10 which will be the height of the bar. So we have figure as \[\]
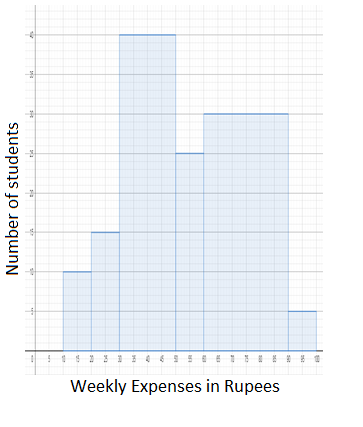
We similarly find the width of other bins 20-30, 30-50, 50-60, 60-90, 90-100 as 10, 20, 10, 30, 10 respectively and the corresponding height as 10, 15, 40, 25, and 30. We draw the adjacent rectangular bars starting for the bin 20-30. We have the required histogram as \[\]
Note: We note that it is not the height but the area of the rectangular bars (width $\times $ height) that represents how much frequency is distributed within the bin. We must be careful of the confusion between histogram and bar chart. The histogram is a type of bar chart where the frequency is distributed over continuous bins as vertical bars but bar charts can also take discontinuous categories with or horizontal bars.
Complete step by step answer:
We know that histogram is an approximate representation of distribution of numerical data. We need a range of values called bins or intervals and the number of items that fall into a particular bin also called frequency. The bins have to be continuous, non-overlapping and most of the time equal. . \[\]
The histogram consists of adjacent vertical rectangular bars on the horizontal axis whose width is proportional to the width of the bin and height is proportional to corresponding frequency of the bin frequencies. \[\]
Let us observe the given table of the weekly pocket expenses of 125 students of a school from the question. . \[\]
| Weekly Expenses (In Rs) | No. Of students |
| 10-20 | 10 |
| 20-30 | 15 |
| 30-50 | 40 |
| 50-60 | 25 |
| 60-90 | 30 |
| 90-100 | 5 |
We are given 7 bins of weekly expenses in rupees and their corresponding frequencies as the number of students. We see that the bins are not of equal width for example the width of first bin from the top is $20-10=10$ , the width of third bin is $50-30=20$ and the width of fifth bin is $90-60=30.$ . \[\]
Let us draw the first rectangular bar for the bin 10-20 whose width is $20-10=10$ and its frequency is 10 which will be the height of the bar. So we have figure as \[\]
We similarly find the width of other bins 20-30, 30-50, 50-60, 60-90, 90-100 as 10, 20, 10, 30, 10 respectively and the corresponding height as 10, 15, 40, 25, and 30. We draw the adjacent rectangular bars starting for the bin 20-30. We have the required histogram as \[\]
Note: We note that it is not the height but the area of the rectangular bars (width $\times $ height) that represents how much frequency is distributed within the bin. We must be careful of the confusion between histogram and bar chart. The histogram is a type of bar chart where the frequency is distributed over continuous bins as vertical bars but bar charts can also take discontinuous categories with or horizontal bars.
Recently Updated Pages
Master Class 8 Social Science: Engaging Questions & Answers for Success
Master Class 8 English: Engaging Questions & Answers for Success
Class 8 Question and Answer - Your Ultimate Solutions Guide
Master Class 8 Maths: Engaging Questions & Answers for Success
Master Class 8 Science: Engaging Questions & Answers for Success
Master Class 9 General Knowledge: Engaging Questions & Answers for Success
Trending doubts
What is BLO What is the full form of BLO class 8 social science CBSE
Citizens of India can vote at the age of A 18 years class 8 social science CBSE
Full form of STD, ISD and PCO
Advantages and disadvantages of science
Right to vote is a AFundamental Right BFundamental class 8 social science CBSE
What are the 12 elements of nature class 8 chemistry CBSE