


Explain the miller's experiment with the help of diagrams?
Answer
588k+ views
Hint:
In this experiment Miller created exactly the same conditions at the laboratory level as predicted on proto-Earth. He observed the formation of simple amino acids such as glycine, alanine and aspartic acid.
Complete answer:
In this question we have asked to explain Miller's experiment. As we already mentioned In 1953, American scientist S.L. Miller created exactly the same conditions at the laboratory level as predicted on proto-Earth. In his experiment, he observed the formation of simple amino acids such as glycine, alanine and aspartic acid. Through his experiment, he presented evidence in favour of organic compounds forming the basis of evolution.
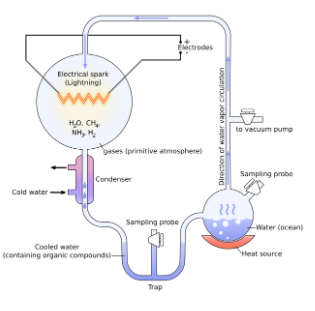
He conducted an experiment to understand the origin of life. We can see in this diagram that Miller took molecules that were the major components of the early earth. He put them into sterile glass tubes and flasks connected together in a loop and circulated inside the apparatus. These gases were methane, ammonia, hydrogen, and water. When he passed an electric current through the system, which was similar to lightning storms which was common on early earth. In 7 to 8 day he saw that some methane and other molecules changed into organic compounds like protein and carbon. So, this experiment proves that organic compounds, which are required for cellular life, were made spontaneously from those gases under the conditions believed to be present on the early earth.
Note: In Miller's experiment he synthesized glycine, aspartic acid and alanine in abundance quantities while glutamic acid is not synthesized in their experiment.
In this experiment Miller created exactly the same conditions at the laboratory level as predicted on proto-Earth. He observed the formation of simple amino acids such as glycine, alanine and aspartic acid.
Complete answer:
In this question we have asked to explain Miller's experiment. As we already mentioned In 1953, American scientist S.L. Miller created exactly the same conditions at the laboratory level as predicted on proto-Earth. In his experiment, he observed the formation of simple amino acids such as glycine, alanine and aspartic acid. Through his experiment, he presented evidence in favour of organic compounds forming the basis of evolution.
He conducted an experiment to understand the origin of life. We can see in this diagram that Miller took molecules that were the major components of the early earth. He put them into sterile glass tubes and flasks connected together in a loop and circulated inside the apparatus. These gases were methane, ammonia, hydrogen, and water. When he passed an electric current through the system, which was similar to lightning storms which was common on early earth. In 7 to 8 day he saw that some methane and other molecules changed into organic compounds like protein and carbon. So, this experiment proves that organic compounds, which are required for cellular life, were made spontaneously from those gases under the conditions believed to be present on the early earth.
Note: In Miller's experiment he synthesized glycine, aspartic acid and alanine in abundance quantities while glutamic acid is not synthesized in their experiment.
Recently Updated Pages
Master Class 12 Economics: Engaging Questions & Answers for Success
Master Class 12 Physics: Engaging Questions & Answers for Success
Master Class 12 English: Engaging Questions & Answers for Success
Master Class 12 Social Science: Engaging Questions & Answers for Success
Master Class 12 Maths: Engaging Questions & Answers for Success
Master Class 12 Business Studies: Engaging Questions & Answers for Success
Trending doubts
Which are the Top 10 Largest Countries of the World?
What are the major means of transport Explain each class 12 social science CBSE
Draw a labelled sketch of the human eye class 12 physics CBSE
Why cannot DNA pass through cell membranes class 12 biology CBSE
Differentiate between insitu conservation and exsitu class 12 biology CBSE
Draw a neat and well labeled diagram of TS of ovary class 12 biology CBSE