Find the median of the given data graphically.
x 2-4 4-6 6-8 8-10 frequency 1 3 5 7
(a) 4
(b) 7
(c) 8
(d) 10
| x | 2-4 | 4-6 | 6-8 | 8-10 |
| frequency | 1 | 3 | 5 | 7 |
Answer
579.6k+ views
Hint: We start solving the problem by checking whether the given frequency distribution is continuous or not. If it is continuous, we proceed further into the problem to find median otherwise, we make corrections at the lower and upper boundaries to make it continuous. We then find the cumulative frequencies in ascending and descending order. We then plot these curves and find the value of x at the intersection of both curves which is the required value of median.
Complete step by step answer:
According to the problem, we need to find the median of the given data in the frequency distribution table graphically.
We can see that the upper limit of the previous interval of x is equal to the lower limit of the next interval of x, which makes the given frequency distribution table continuous.
Let us find the sum of the given frequencies.
Now, let us find the cumulative frequency for each interval of x in the ascending way.
So, we get
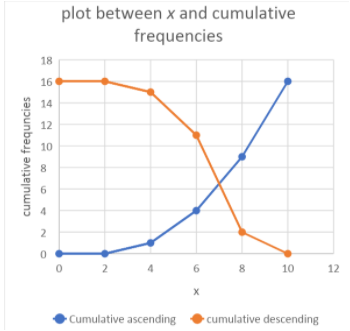
Let us plot the graph between x and the cumulative frequency which we can see from the frequency table.
Now, let us find the cumulative frequency for each interval of x in the descending way.
So, we get
Let us plot the graph between x and the cumulative frequency which we can see from the frequency table in the same graph we plotted before.

We know that the median of the given frequency distribution lies at the intersection of both cumulative frequency curves.
From the plot, we can see that the cumulative frequency curves intersect at $x=7$, which is the median.
So, we have found the median as 7.
The correct option for the given problem is (b).
Note:
We should know that the median obtained need not be absolutely correct. We can plot one curve and check at the cumulative frequency $\dfrac{16}{2}=8$, but the values of the median will be different in both the plots. This is the reason why we need to plot both curves in a single graph. Similarly, we can expect problems to find the median without graphical methods.
Complete step by step answer:
According to the problem, we need to find the median of the given data in the frequency distribution table graphically.
| x | 2-4 | 4-6 | 6-8 | 8-10 |
| frequency | 1 | 3 | 5 | 7 |
We can see that the upper limit of the previous interval of x is equal to the lower limit of the next interval of x, which makes the given frequency distribution table continuous.
Let us find the sum of the given frequencies.
| x | frequency |
| 2-4 | 1 |
| 4-6 | 3 |
| 6-8 | 5 |
| 8-10 | 7 |
| Total | 16 |
Now, let us find the cumulative frequency for each interval of x in the ascending way.
So, we get
| x | Cumulative frequency |
| Less than 2 | 0 |
| Less than 4 | 1 |
| Less than 6 | 4 |
| Less than 8 | 9 |
| Less than 10 | 16 |
Let us plot the graph between x and the cumulative frequency which we can see from the frequency table.
Now, let us find the cumulative frequency for each interval of x in the descending way.
So, we get
| x | Cumulative frequency |
| more than 2 | 16 |
| more than 4 | 15 |
| more than 6 | 11 |
| more than 8 | 2 |
| more than 10 | 0 |
Let us plot the graph between x and the cumulative frequency which we can see from the frequency table in the same graph we plotted before.

We know that the median of the given frequency distribution lies at the intersection of both cumulative frequency curves.
From the plot, we can see that the cumulative frequency curves intersect at $x=7$, which is the median.
So, we have found the median as 7.
The correct option for the given problem is (b).
Note:
We should know that the median obtained need not be absolutely correct. We can plot one curve and check at the cumulative frequency $\dfrac{16}{2}=8$, but the values of the median will be different in both the plots. This is the reason why we need to plot both curves in a single graph. Similarly, we can expect problems to find the median without graphical methods.
Recently Updated Pages
Master Class 11 Computer Science: Engaging Questions & Answers for Success

Master Class 11 Business Studies: Engaging Questions & Answers for Success

Master Class 11 Economics: Engaging Questions & Answers for Success

Master Class 11 English: Engaging Questions & Answers for Success

Master Class 11 Maths: Engaging Questions & Answers for Success

Master Class 11 Biology: Engaging Questions & Answers for Success

Trending doubts
One Metric ton is equal to kg A 10000 B 1000 C 100 class 11 physics CBSE

There are 720 permutations of the digits 1 2 3 4 5 class 11 maths CBSE

Discuss the various forms of bacteria class 11 biology CBSE

Draw a diagram of a plant cell and label at least eight class 11 biology CBSE

State the laws of reflection of light

Explain zero factorial class 11 maths CBSE


