


Find the mode of following frequency distribution. \[\]

Answer
584.4k+ views
Hint: We use the fact that if the data is in groups or class interval , the modal interval ${{I}_{m}}$corresponds to highest frequency ${{f}_{m}}$. We then use the formula for the mode $M$$M=L+\dfrac{{{f}_{m}}-{{f}_{m-1}}}{\left( {{f}_{m}}-{{f}_{m-1}} \right)\left( {{f}_{m}}-{{f}_{m+1}} \right)}\times w$ where L is the lower boundary, $w$ is the width of the modal interval ${{I}_{m}}$, ${{f}_{m-1}},{{f}_{m+1}}$ are the frequencies of the class intervals ${{I}_{m-1}},{{I}_{m+1}}$ respectively. \[\]
Complete step by step answer:
We know that mode is a measure of the central tendency of the data or population. It expresses just like mean and median the most important value towards which all the data points show a tendency. The highest value in the data is called mode. If there are $n$ data points say ${{x}_{1}},{{x}_{2}},...,{{x}_{n}}$ then $M$ is will be the mode and if only if
\[M>{{x}_{i}},i=1,2,3...n\]
It may also happen that the highest value of $M$ may occur several times. So in accordance, we call the data unimodal if $M$ occurs only once, bimodal if $M$ occurs twice, trimodal if $M$ occurs thrice, and so on.
When we have the data in groups or class intervals we first find the modal interval which corresponds to highest frequency . If the grouped data has $n$ intervals say ${{I}_{1}},{{I}_{2}},...,{{I}_{n}}$ and their corresponding frequencies${{f}_{1}},{{f}_{2}},..{{f}_{n}}$, then ${{I}_{m}},m=1,2,..n$ will be the modal interval if ${{I}_{m}}$ has the frequency ${{f}_{m}}$ such that
\[{{f}_{m}}>{{f}_{i}},i=1,2,..n\]
We then estimate the mode using the following formula and conclude whether ${{I}_{m}}$ is the modal interval or not.
\[M=L+\dfrac{{{f}_{m}}-{{f}_{m-1}}}{\left( {{f}_{m}}-{{f}_{m-1}} \right)\left( {{f}_{m}}-{{f}_{m+1}} \right)}\times w\]
Here L is the lower boundary, $w$ is the width of the modal interval. The frequency${{f}_{m-1}}$ is the frequency corresponding to the interval right before ${{I}_{m}}$ that is ${{I}_{m-1}}$ and the frequency ${{f}_{m+1}}$ is the frequency corresponding to the interval right after ${{I}_{m}}$ that is ${{I}_{m+1}}$.
So let us observe the data given in the question. \[\]
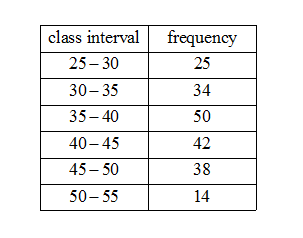
We see the highest frequency is 50 and its corresponding interval is 35-50. So we have ${{f}_{m}}=50$the modal interval ${{I}_{m}}=\left[ 35,40 \right]$. The width of ${{I}_{m}}$is $w=40-35=5$ and the lower boundary of ${{I}_{m}}$is $L=35$. The frequency of ${{I}_{m-1}}$ is ${{f}_{m-1}}=34$ and of ${{I}_{m+1}}$ is ${{f}_{m-1}}=42$.Now we estimate the mode using the formula. We have,
\[\begin{align}
& M=35+\dfrac{50-34}{\left( 50-34 \right)\left( 50-42 \right)}\times 5 \\
& =35+\dfrac{6}{6\times 8}\times 5 \\
& =35+.625=35.625 \\
\end{align}\]
We see that the estimated mode lie in the interval ${{I}_{m}}=\left[ 35,40 \right]$. So the mode is $\left[ 35,40 \right]$\[\]
Note:
If the frequency 50 would have occurred more than once we would more than modal intervals. The mean of the class interval data is determined using the formula $\mu =\dfrac{\sum\limits_{i=1}^{n}{{{f}_{i}}{{x}_{i}}}}{\sum\limits_{i=1}^{n}{{{f}_{i}}}}$ where${{x}_{i}}$ is the midpoint of the interval ${{I}_{i.}}$ The median is the interval that corresponds to $\dfrac{\sum\limits_{i=1}^{n}{{{f}_{i}}}}{2}$.
Complete step by step answer:
We know that mode is a measure of the central tendency of the data or population. It expresses just like mean and median the most important value towards which all the data points show a tendency. The highest value in the data is called mode. If there are $n$ data points say ${{x}_{1}},{{x}_{2}},...,{{x}_{n}}$ then $M$ is will be the mode and if only if
\[M>{{x}_{i}},i=1,2,3...n\]
It may also happen that the highest value of $M$ may occur several times. So in accordance, we call the data unimodal if $M$ occurs only once, bimodal if $M$ occurs twice, trimodal if $M$ occurs thrice, and so on.
When we have the data in groups or class intervals we first find the modal interval which corresponds to highest frequency . If the grouped data has $n$ intervals say ${{I}_{1}},{{I}_{2}},...,{{I}_{n}}$ and their corresponding frequencies${{f}_{1}},{{f}_{2}},..{{f}_{n}}$, then ${{I}_{m}},m=1,2,..n$ will be the modal interval if ${{I}_{m}}$ has the frequency ${{f}_{m}}$ such that
\[{{f}_{m}}>{{f}_{i}},i=1,2,..n\]
We then estimate the mode using the following formula and conclude whether ${{I}_{m}}$ is the modal interval or not.
\[M=L+\dfrac{{{f}_{m}}-{{f}_{m-1}}}{\left( {{f}_{m}}-{{f}_{m-1}} \right)\left( {{f}_{m}}-{{f}_{m+1}} \right)}\times w\]
Here L is the lower boundary, $w$ is the width of the modal interval. The frequency${{f}_{m-1}}$ is the frequency corresponding to the interval right before ${{I}_{m}}$ that is ${{I}_{m-1}}$ and the frequency ${{f}_{m+1}}$ is the frequency corresponding to the interval right after ${{I}_{m}}$ that is ${{I}_{m+1}}$.
So let us observe the data given in the question. \[\]
We see the highest frequency is 50 and its corresponding interval is 35-50. So we have ${{f}_{m}}=50$the modal interval ${{I}_{m}}=\left[ 35,40 \right]$. The width of ${{I}_{m}}$is $w=40-35=5$ and the lower boundary of ${{I}_{m}}$is $L=35$. The frequency of ${{I}_{m-1}}$ is ${{f}_{m-1}}=34$ and of ${{I}_{m+1}}$ is ${{f}_{m-1}}=42$.Now we estimate the mode using the formula. We have,
\[\begin{align}
& M=35+\dfrac{50-34}{\left( 50-34 \right)\left( 50-42 \right)}\times 5 \\
& =35+\dfrac{6}{6\times 8}\times 5 \\
& =35+.625=35.625 \\
\end{align}\]
We see that the estimated mode lie in the interval ${{I}_{m}}=\left[ 35,40 \right]$. So the mode is $\left[ 35,40 \right]$\[\]
Note:
If the frequency 50 would have occurred more than once we would more than modal intervals. The mean of the class interval data is determined using the formula $\mu =\dfrac{\sum\limits_{i=1}^{n}{{{f}_{i}}{{x}_{i}}}}{\sum\limits_{i=1}^{n}{{{f}_{i}}}}$ where${{x}_{i}}$ is the midpoint of the interval ${{I}_{i.}}$ The median is the interval that corresponds to $\dfrac{\sum\limits_{i=1}^{n}{{{f}_{i}}}}{2}$.
Recently Updated Pages
Master Class 10 Computer Science: Engaging Questions & Answers for Success
Master Class 10 General Knowledge: Engaging Questions & Answers for Success
Master Class 10 English: Engaging Questions & Answers for Success
Master Class 10 Social Science: Engaging Questions & Answers for Success
Master Class 10 Maths: Engaging Questions & Answers for Success
Master Class 10 Science: Engaging Questions & Answers for Success
Trending doubts
What is the median of the first 10 natural numbers class 10 maths CBSE
Which women's tennis player has 24 Grand Slam singles titles?
Who is the Brand Ambassador of Incredible India?
Why is there a time difference of about 5 hours between class 10 social science CBSE
Write a letter to the principal requesting him to grant class 10 english CBSE
A moving boat is observed from the top of a 150 m high class 10 maths CBSE