


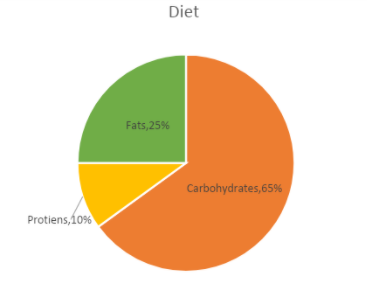
Following pie chart shows the consumption of the balanced diet, provided in the mid-day meal of a Primary school. If a child needs 2500 calories in his food daily, find the amount of each (in calories) in his daily food intake.
Answer
589.5k+ views
Hint: We are given the total calories. From the pie chart, we have the percentage of each nutrient. So we can find the amount of each nutrient by taking the respective percentage of the nutrient in the balanced diet from the pie chart.
Complete step by step solution: We are given that the total calories the child needs are 2500.
From the pie chart, the percentage of carbohydrate is $65\% $. So the amount of carbohydrates is $65\% $ of 2500.
Amount of carbohydrates $ = 2500 \times 65\% $
On writing the percentage as fraction, we get,
$ = 2500 \times \dfrac{{65}}{{100}}$
On cancelling the zeros, we get,
$ = 25 \times 65$
$ = 1625$
Therefore the amount of carbohydrates is 1625 calories.
From the pie chart, the percentage of proteins is $10\% $. So the amount of proteins is $10\% $ of 2500.
Amount of proteins$ = 2500 \times 10\% $
On writing the percentage as fraction, we get,
$ = 2500 \times \dfrac{{10}}{{100}}$
On cancelling the zeros, we get,
$ = 250$
Therefore the amount of proteins is 250 calories.
From the pie chart, the percentage of fats is $25\% $. So the amount of fats is $25\% $ of 2500.
Amount of carbohydrates $ = 2500 \times 25\% $
On writing the percentage as fraction, we get,
$ = 2500 \times \dfrac{{25}}{{100}}$
On cancelling the zeros, we get,
$ = 25 \times 25$
$ = 625$
Therefore the amount of fats is 625 calories.
Thus, the daily intake of a child has 1625 calories of carbohydrates, 250 calories of proteins and 625 calories of fats.
Note: A pie chart is a diagrammatic representation of relative data. In a pie chart, a full circle is divided into slices and each slice represents each data. The arc length, the central angle and area of each slice will be proportional to the quantity of the data it represents. In this problem, we must find the amount of each nutrient. This can be found in any order. After finding the amount of all the nutrients, we can take their sum and check whether it gives the total required diet. After finding any two quantities, the third one can be found out by subtracting their sum from the total.
Recently Updated Pages
Master Class 9 General Knowledge: Engaging Questions & Answers for Success
Master Class 9 Social Science: Engaging Questions & Answers for Success
Master Class 9 English: Engaging Questions & Answers for Success
Master Class 9 Maths: Engaging Questions & Answers for Success
Master Class 9 Science: Engaging Questions & Answers for Success
Class 9 Question and Answer - Your Ultimate Solutions Guide
Trending doubts
Difference Between Plant Cell and Animal Cell
Fill the blanks with the suitable prepositions 1 The class 9 english CBSE
Who is eligible for RTE class 9 social science CBSE
Which places in India experience sunrise first and class 9 social science CBSE
What is pollution? How many types of pollution? Define it
Name 10 Living and Non living things class 9 biology CBSE