


How do you graph a linear inequality in only one variable?
Answer
546.6k+ views
Hint: We first take an arbitrary inequation as $x<-0.5$. Then we try to take points which have x coordinates less than $-0.5$. There is no restriction on the y coordinates. Based on the points we try to find the space or region in the 2-D plane which satisfies $x<-0.5$.
Complete step-by-step solution:
We try to take an arbitrary linear inequality in only one variable as $x<-0.5$.
The inequation $x<-0.5$ represents the space or region in 2-D plane where the x coordinates of points are valued less than $-0.5$.
We first take some points for the x coordinates where $x<-0.5$.
The values will be $x=-1,-2,-5,-10$.
We can take the y coordinate anything we want. The inequation is only based on the values of the x coordinates.
So, for y coordinate we take $y=-2,5,0,-10$ respectively for the x coordinates $x=-1,-2,-5,-10$
The points are $\left( x,y \right)=\left( -1,-2 \right);\left( -2,5 \right);\left( -5,0 \right);\left( -10,-10 \right)$.
We put these points in the graph to get
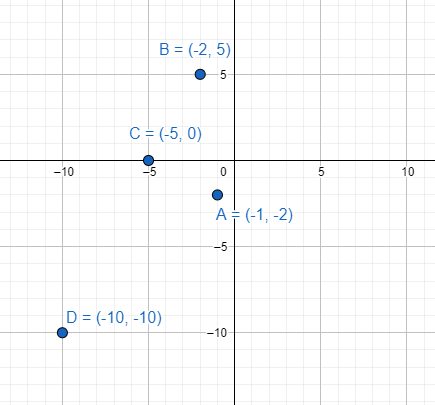
Based on the points we can measure the region.
Now we try to draw the line $x=-0.5=-\dfrac{1}{2}$.
Then we take all the x coordinates which have less value than $x=-\dfrac{1}{2}$.
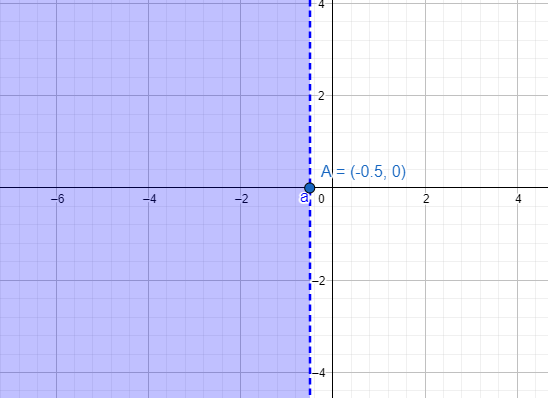
The dotted line is the equation $x=-\dfrac{1}{2}$. All the points on the left side have x coordinates valued less than $x=-\dfrac{1}{2}$. So, all those points on the marked area are solutions to the inequation $x<-0.5$.
Note: We can also express the inequality as the interval system where $x<-0.5$ defines that $x\in \left( -\infty ,-0.5 \right)$. The interval for the y coordinates will be anything which can be defined as $y\in \left( -\infty ,\infty \right)$. We also need to remember that the points on the line $x=-0.5$ will not be the solution for the inequation.
Complete step-by-step solution:
We try to take an arbitrary linear inequality in only one variable as $x<-0.5$.
The inequation $x<-0.5$ represents the space or region in 2-D plane where the x coordinates of points are valued less than $-0.5$.
We first take some points for the x coordinates where $x<-0.5$.
The values will be $x=-1,-2,-5,-10$.
We can take the y coordinate anything we want. The inequation is only based on the values of the x coordinates.
So, for y coordinate we take $y=-2,5,0,-10$ respectively for the x coordinates $x=-1,-2,-5,-10$
The points are $\left( x,y \right)=\left( -1,-2 \right);\left( -2,5 \right);\left( -5,0 \right);\left( -10,-10 \right)$.
We put these points in the graph to get
Based on the points we can measure the region.
Now we try to draw the line $x=-0.5=-\dfrac{1}{2}$.
Then we take all the x coordinates which have less value than $x=-\dfrac{1}{2}$.
The dotted line is the equation $x=-\dfrac{1}{2}$. All the points on the left side have x coordinates valued less than $x=-\dfrac{1}{2}$. So, all those points on the marked area are solutions to the inequation $x<-0.5$.
Note: We can also express the inequality as the interval system where $x<-0.5$ defines that $x\in \left( -\infty ,-0.5 \right)$. The interval for the y coordinates will be anything which can be defined as $y\in \left( -\infty ,\infty \right)$. We also need to remember that the points on the line $x=-0.5$ will not be the solution for the inequation.

Recently Updated Pages
Master Class 8 Social Science: Engaging Questions & Answers for Success
Master Class 8 English: Engaging Questions & Answers for Success
Class 8 Question and Answer - Your Ultimate Solutions Guide
Master Class 8 Maths: Engaging Questions & Answers for Success
Master Class 8 Science: Engaging Questions & Answers for Success
Master Class 9 General Knowledge: Engaging Questions & Answers for Success
Trending doubts
What is BLO What is the full form of BLO class 8 social science CBSE
Citizens of India can vote at the age of A 18 years class 8 social science CBSE
Full form of STD, ISD and PCO
Advantages and disadvantages of science
Right to vote is a AFundamental Right BFundamental class 8 social science CBSE
What are the 12 elements of nature class 8 chemistry CBSE