


How do you graph by $x=6$ plotting points ?
Answer
557.7k+ views
Hint: The general equation of a line is $ax+by+c=0$ . In the given equation , the coefficient of is 0. So we can conclude that the given line is parallel to the y-axis. This conveys us that the value of is constant irrespective of the value of $y$
Complete step by step answer:
Now let us consider some values of $y$ keeping as $x$ has a constant value,which is already mentioned in the question i.e $x=6$ .
Let us consider the first point E(6,4).
Let the second point be D(6,3).
Let the third point be C(6,2).
Let the fourth point be B(6,1).
Let the fifth point be A(6,0).
Let the sixth point be F(6,-1).
Let the seventh point be G (6,-2).
Let the eight point be H(6,-3).
Let the ninth point be I(6,-4).
We know that the first four points lie in the first quadrant since the coordinate and the co-ordinate are positive. The fifth point lies on the - axis as the coordinate is 0.And the last four points lie in the fourth quadrant since the coordinate is positive and the coordinate is negative.
After plotting , the graph would look like this :
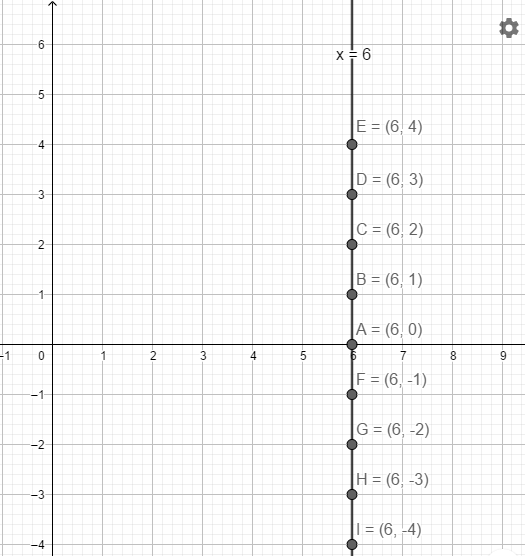
Hence, we can say that the graph of $x=6$ is a line parallel to the $y$-axis and passing through (6,0)
Note:
Please choose the appropriate scale for the both $x$ - axis and $y$ - axis before plotting the points.In this case, the ideal would be 1 unit = 1 cm for both the axes as the values of the coordinates is quite small. Plot the points carefully and join them.
Complete step by step answer:
Now let us consider some values of $y$ keeping as $x$ has a constant value,which is already mentioned in the question i.e $x=6$ .
Let us consider the first point E(6,4).
Let the second point be D(6,3).
Let the third point be C(6,2).
Let the fourth point be B(6,1).
Let the fifth point be A(6,0).
Let the sixth point be F(6,-1).
Let the seventh point be G (6,-2).
Let the eight point be H(6,-3).
Let the ninth point be I(6,-4).
We know that the first four points lie in the first quadrant since the coordinate and the co-ordinate are positive. The fifth point lies on the - axis as the coordinate is 0.And the last four points lie in the fourth quadrant since the coordinate is positive and the coordinate is negative.
After plotting , the graph would look like this :
Hence, we can say that the graph of $x=6$ is a line parallel to the $y$-axis and passing through (6,0)
Note:
Please choose the appropriate scale for the both $x$ - axis and $y$ - axis before plotting the points.In this case, the ideal would be 1 unit = 1 cm for both the axes as the values of the coordinates is quite small. Plot the points carefully and join them.
Recently Updated Pages
Master Class 11 Computer Science: Engaging Questions & Answers for Success
Master Class 11 Business Studies: Engaging Questions & Answers for Success
Master Class 11 Economics: Engaging Questions & Answers for Success
Master Class 11 English: Engaging Questions & Answers for Success
Master Class 11 Maths: Engaging Questions & Answers for Success
Master Class 11 Biology: Engaging Questions & Answers for Success
Trending doubts
One Metric ton is equal to kg A 10000 B 1000 C 100 class 11 physics CBSE
There are 720 permutations of the digits 1 2 3 4 5 class 11 maths CBSE
Discuss the various forms of bacteria class 11 biology CBSE
Draw a diagram of a plant cell and label at least eight class 11 biology CBSE
State the laws of reflection of light
Explain zero factorial class 11 maths CBSE