


How do you graph the equation \[y - 8 = - x\] by making a table and what is its domain and range?
Answer
540.9k+ views
Hint: Here firstly we need to arrange the equation in \[y\] terms for finding the value of \[x\] and \[y\] considering them as different values and drawing table by giving random values for \[x\] and finding value of \[y\] . Later on we will plot the graph \[x\] versus \[y\] with the help of values from the table. The graph can also be drawn using the intercept method and lastly we will find the domain and the range.
Formula: By using the table of function we will take the random value of \[x\] and substitute in the equation for finding the value of \[y\] . Later on after finding the sufficient points we will sketch the graph
Complete step-by-step answer:
We are given the equation \[y - 8 = - x\] . So firstly we need to solve for \[y\]
After adding \[8\] to both the sides of the equation we will get
\[y - 8 + 8 = - x + 8\]
After further simplification we get
\[y = - x + 8\]
Now we will draw a table by taking random values of x and putting in the equation to get value of y
Thus after getting various coordinates we will sketch a graph for these coordinates
We will expand the line by matching the points one line and we will notice \[y\] is having all the real numbers.
Now we will find the domain and range and as we know that function domain and range are all the real numbers as there is nothing we can put for \[x\] and y that won’t work. That is the reason why the graph extends forever in the \[x\] directions and also extends forever in the \[y\] direction. Hence domain and range is all the real numbers.
Hence domain is \[( - \infty , + \infty )\] and range is \[( - \infty , + \infty )\]
Note: Here in this question we are given a linear equation with two variables \[x\] and y where \[x\] is measures along \[x\] axis and \[y\] is measured along \[y\] axis while tracing the given equation. Remember we need to arrange the equation in \[y\] terms so that different \[y\] values can be calculated by taking random values of \[x\] .Mark the points carefully for getting the correct graph for the given equation.
Formula: By using the table of function we will take the random value of \[x\] and substitute in the equation for finding the value of \[y\] . Later on after finding the sufficient points we will sketch the graph
Complete step-by-step answer:
We are given the equation \[y - 8 = - x\] . So firstly we need to solve for \[y\]
After adding \[8\] to both the sides of the equation we will get
\[y - 8 + 8 = - x + 8\]
After further simplification we get
\[y = - x + 8\]
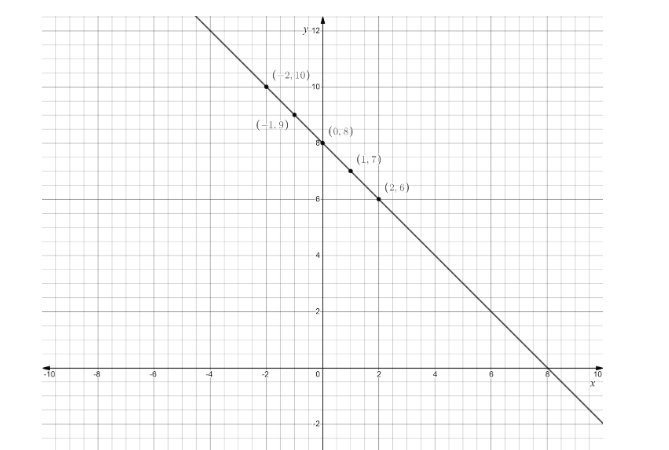
Now we will draw a table by taking random values of x and putting in the equation to get value of y
| \[x\] | \[ - 2\] | \[ - 1\] | \[0\] | \[1\] | \[2\] |
| y | \[10\] | \[9\] | \[8\] | \[7\] | \[6\] |
Thus after getting various coordinates we will sketch a graph for these coordinates
We will expand the line by matching the points one line and we will notice \[y\] is having all the real numbers.
Now we will find the domain and range and as we know that function domain and range are all the real numbers as there is nothing we can put for \[x\] and y that won’t work. That is the reason why the graph extends forever in the \[x\] directions and also extends forever in the \[y\] direction. Hence domain and range is all the real numbers.
Hence domain is \[( - \infty , + \infty )\] and range is \[( - \infty , + \infty )\]
Note: Here in this question we are given a linear equation with two variables \[x\] and y where \[x\] is measures along \[x\] axis and \[y\] is measured along \[y\] axis while tracing the given equation. Remember we need to arrange the equation in \[y\] terms so that different \[y\] values can be calculated by taking random values of \[x\] .Mark the points carefully for getting the correct graph for the given equation.

Recently Updated Pages
Master Class 8 Social Science: Engaging Questions & Answers for Success
Master Class 8 English: Engaging Questions & Answers for Success
Class 8 Question and Answer - Your Ultimate Solutions Guide
Master Class 8 Maths: Engaging Questions & Answers for Success
Master Class 8 Science: Engaging Questions & Answers for Success
Master Class 9 General Knowledge: Engaging Questions & Answers for Success
Trending doubts
What is BLO What is the full form of BLO class 8 social science CBSE
Citizens of India can vote at the age of A 18 years class 8 social science CBSE
Full form of STD, ISD and PCO
Advantages and disadvantages of science
Right to vote is a AFundamental Right BFundamental class 8 social science CBSE
What are the 12 elements of nature class 8 chemistry CBSE