


How do you graph the function \[f\left( x \right)=-\dfrac{1}{2}x+3\]?
Answer
553.8k+ views
Hint: To find the graph for the given equation we have to convert the given straight line equation into intercept form. For converting our equation into intercept form we have to do some operations. After that we will get an X and Y intercept for the given equation. So, by plotting them we will get the graph
Complete step by step answer:
For the given question we have to draw a graph for the function \[f\left( x \right)=-\dfrac{1}{2}x+3\].
Let us assume the above equation as y and mark it as equation (1).
\[y=-\dfrac{1}{2}x+3.............\left( 1 \right)\]
If we convert the equation (1) to intercept form we will get two points which are used to plot the graph easily.
As we know the intercept form of a straight line equation is \[\dfrac{x}{a}+\dfrac{y}{b}=1\].
Let us consider the formula \[\dfrac{x}{a}+\dfrac{y}{b}=1\] as formula (f1).
\[\begin{align}
& \dfrac{x}{a}+\dfrac{y}{b}=1.........\left( f1 \right) \\
& \\
\end{align}\]
Now let us convert our straight line equation into intercept form.
So, for converting equation (1) as intercept form we have to do some operations.
By transferring \[-\dfrac{1}{2}x\] from RHS (right hand side) to LHS (left hand side), we get
\[\Rightarrow y+\dfrac{1}{2}x=3\]
Let us consider
\[y+\dfrac{1}{2}x=3.......\left( 2 \right)\]
By observing equation (1) we can see that RHS of equation (1) is equal to 1.
So, let us make RHS of equation (2) to 1, for that we have to divide both sides of equation with 3.
By dividing both sides of equation (2) with 3, we get
\[\Rightarrow \dfrac{x}{6}+\dfrac{y}{3}=1\]
Let us consider
\[\dfrac{x}{6}+\dfrac{y}{3}=1..........\left( 3 \right)\]
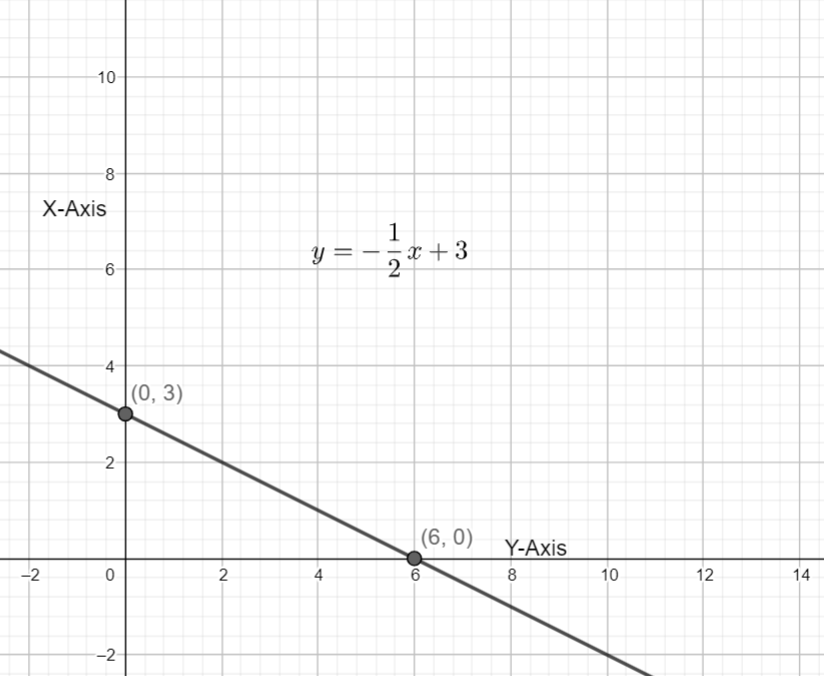
Therefore from the equation (3), X and Y intercepts are (-6, 0) and (0, 3) respectively.
Plotting the graph using the X and Y intercept.
Note:
Another way to do this is find any two distinct points on the graph then draw a straight line through them. For that substitute the x values in f(x). Therefore we will get ordered pairs in the form (x, f(x)). By plotting these points we will get the resultant graph.
Complete step by step answer:
For the given question we have to draw a graph for the function \[f\left( x \right)=-\dfrac{1}{2}x+3\].
Let us assume the above equation as y and mark it as equation (1).
\[y=-\dfrac{1}{2}x+3.............\left( 1 \right)\]
If we convert the equation (1) to intercept form we will get two points which are used to plot the graph easily.
As we know the intercept form of a straight line equation is \[\dfrac{x}{a}+\dfrac{y}{b}=1\].
Let us consider the formula \[\dfrac{x}{a}+\dfrac{y}{b}=1\] as formula (f1).
\[\begin{align}
& \dfrac{x}{a}+\dfrac{y}{b}=1.........\left( f1 \right) \\
& \\
\end{align}\]
Now let us convert our straight line equation into intercept form.
So, for converting equation (1) as intercept form we have to do some operations.
By transferring \[-\dfrac{1}{2}x\] from RHS (right hand side) to LHS (left hand side), we get
\[\Rightarrow y+\dfrac{1}{2}x=3\]
Let us consider
\[y+\dfrac{1}{2}x=3.......\left( 2 \right)\]
By observing equation (1) we can see that RHS of equation (1) is equal to 1.
So, let us make RHS of equation (2) to 1, for that we have to divide both sides of equation with 3.
By dividing both sides of equation (2) with 3, we get
\[\Rightarrow \dfrac{x}{6}+\dfrac{y}{3}=1\]
Let us consider
\[\dfrac{x}{6}+\dfrac{y}{3}=1..........\left( 3 \right)\]
Therefore from the equation (3), X and Y intercepts are (-6, 0) and (0, 3) respectively.
Plotting the graph using the X and Y intercept.
Note:
Another way to do this is find any two distinct points on the graph then draw a straight line through them. For that substitute the x values in f(x). Therefore we will get ordered pairs in the form (x, f(x)). By plotting these points we will get the resultant graph.
Recently Updated Pages
Master Class 11 Computer Science: Engaging Questions & Answers for Success
Master Class 11 Business Studies: Engaging Questions & Answers for Success
Master Class 11 Economics: Engaging Questions & Answers for Success
Master Class 11 English: Engaging Questions & Answers for Success
Master Class 11 Maths: Engaging Questions & Answers for Success
Master Class 11 Biology: Engaging Questions & Answers for Success
Trending doubts
One Metric ton is equal to kg A 10000 B 1000 C 100 class 11 physics CBSE
There are 720 permutations of the digits 1 2 3 4 5 class 11 maths CBSE
Discuss the various forms of bacteria class 11 biology CBSE
Draw a diagram of a plant cell and label at least eight class 11 biology CBSE
State the laws of reflection of light
Explain zero factorial class 11 maths CBSE