


How do you graph the inequalities \[x \geqslant 4\] or \[x > - 4\] ?
Answer
545.4k+ views
Hint: Here we find the equation of equality in both the cases of inequalities and use the concept that when we have x-axis equal to the value then we include the line and when there is no equality included we only take area after or before the line.
Complete step by step solution:
We will graph the two inequalities separately.
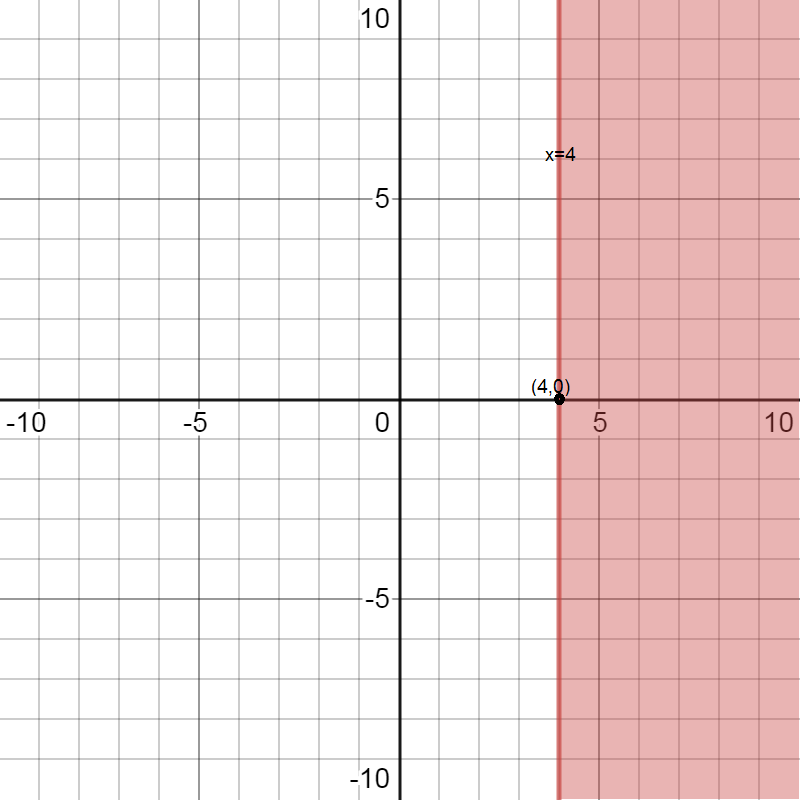
We are given the inequality \[x \geqslant 4\] … (1)
We first find equality of the line by removing the inequality.
The equation of line will be \[x = 4\]
Now we will draw the line on the graph and shade all the areas that are greater than the line. Here the value of x is greater than or equal to 4, so we will include the line as well.
We are given the inequality \[x > - 4\] … (2)
We first find equality of the line by removing the inequality.
The equation of line will be \[x = - 4\]
Now we will draw the line on the graph and shade all the areas that are greater than the line. Here the value of x is greater than -4, so we will not include the line.
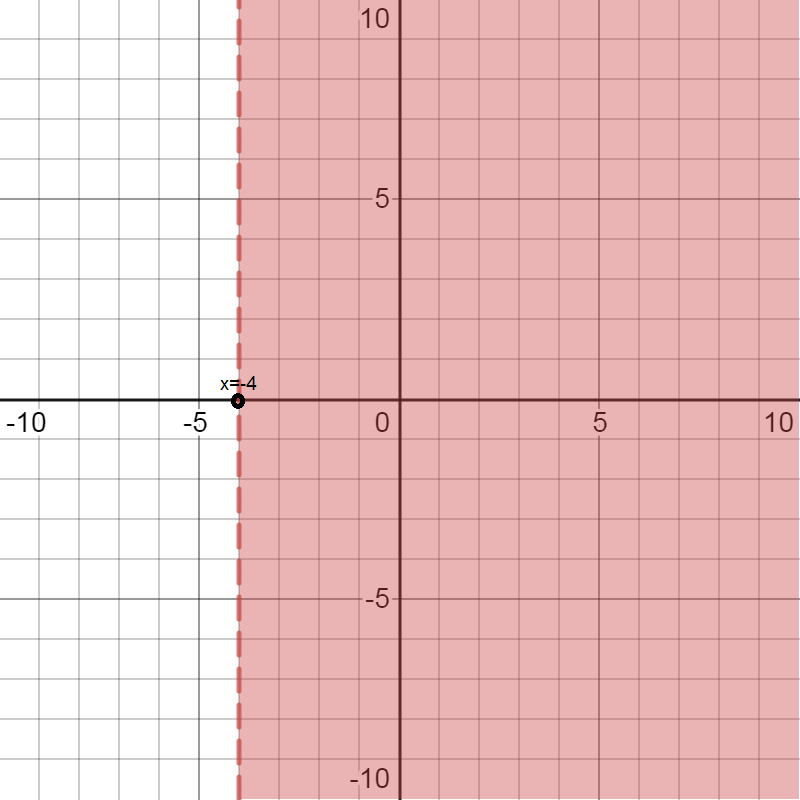
Note: Many students make the mistake of shading the area on the left hand side in the second inequality as they think that numerical values on the left in the negative number line part are greater. Keep in mind that on the number line the values decrease as we move towards left and the values increase as we move towards the right. So, we have to take greater part than the equation of line, so we shade the area on the right hand side of the line.
Complete step by step solution:
We will graph the two inequalities separately.
We are given the inequality \[x \geqslant 4\] … (1)
We first find equality of the line by removing the inequality.
The equation of line will be \[x = 4\]
Now we will draw the line on the graph and shade all the areas that are greater than the line. Here the value of x is greater than or equal to 4, so we will include the line as well.
We are given the inequality \[x > - 4\] … (2)
We first find equality of the line by removing the inequality.
The equation of line will be \[x = - 4\]
Now we will draw the line on the graph and shade all the areas that are greater than the line. Here the value of x is greater than -4, so we will not include the line.
Note: Many students make the mistake of shading the area on the left hand side in the second inequality as they think that numerical values on the left in the negative number line part are greater. Keep in mind that on the number line the values decrease as we move towards left and the values increase as we move towards the right. So, we have to take greater part than the equation of line, so we shade the area on the right hand side of the line.
Recently Updated Pages
Master Class 11 Computer Science: Engaging Questions & Answers for Success
Master Class 11 Business Studies: Engaging Questions & Answers for Success
Master Class 11 Economics: Engaging Questions & Answers for Success
Master Class 11 English: Engaging Questions & Answers for Success
Master Class 11 Maths: Engaging Questions & Answers for Success
Master Class 11 Biology: Engaging Questions & Answers for Success
Trending doubts
One Metric ton is equal to kg A 10000 B 1000 C 100 class 11 physics CBSE
There are 720 permutations of the digits 1 2 3 4 5 class 11 maths CBSE
Discuss the various forms of bacteria class 11 biology CBSE
Draw a diagram of a plant cell and label at least eight class 11 biology CBSE
State the laws of reflection of light
Explain zero factorial class 11 maths CBSE