


How do you graph the inequality \[x\ge 3\] or \[x<-3\]?
Answer
558.3k+ views
Hint: An inequality is used to compare two values whether which value is greater or less between two values. If any inequality needs to be represented on a graph then we shade the part corresponding to the inequality in the graph.
Complete step by step answer:
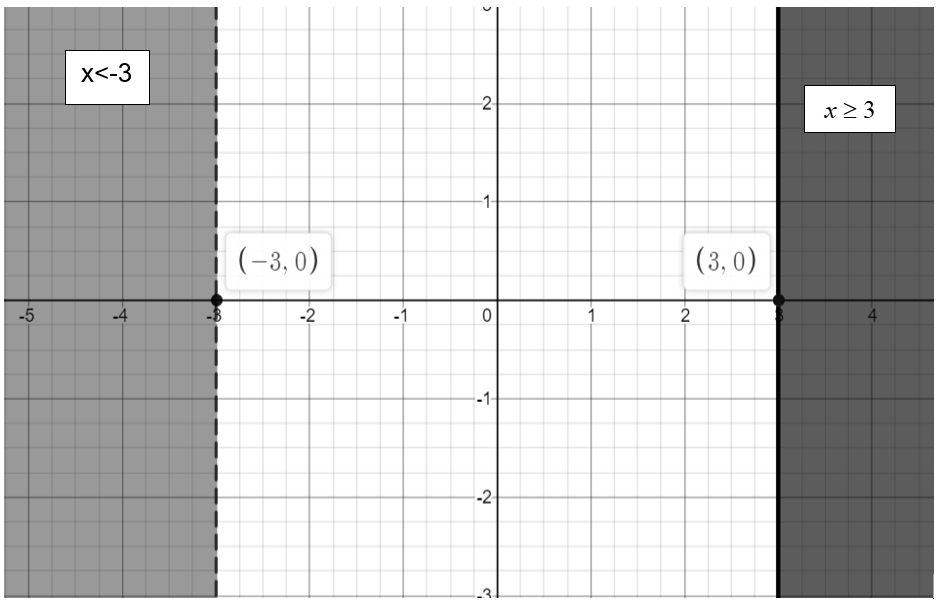
As per the given question, we need to graph the straight line which is given by the equation \[x=3,x=-3\].
These two straight lines \[x=3,x=-3\] will be vertical and parallel to the y-axis.
The line \[x=-3\] meets the x-axis at the point \[\left( -3,0 \right)\].
The line \[x=3\] meets the x-axis at the point \[\left( 3,0 \right)\].
The line \[x=-3\] will be a dashed line since the inequality does not include the value \[x=-3\].
The line will be a solid line because inequality includes the value \[x=3\].
The inequality \[x<-3\] says we need to consider the values which are less than -3. That means we have to shade the part to the left of -3.
The inequality \[x\ge 3\] says that we need to consider the values which are greater than and equal to 3. This means we have to shade the part to the right of 3.
The below graph shows the inequalities \[x<-3\],\[x\ge 3\]:
Note:
In order to solve these types of problems, we need to have knowledge of inequalities and how to plot a graph of inequality. while solving inequalities check which inequality is given carefully to avoid mistakes. We have to check which part to be shaded depending on the inequality given in the problem. We should avoid calculation mistakes to get the correct solution.
Complete step by step answer:
As per the given question, we need to graph the straight line which is given by the equation \[x=3,x=-3\].
These two straight lines \[x=3,x=-3\] will be vertical and parallel to the y-axis.
The line \[x=-3\] meets the x-axis at the point \[\left( -3,0 \right)\].
The line \[x=3\] meets the x-axis at the point \[\left( 3,0 \right)\].
The line \[x=-3\] will be a dashed line since the inequality does not include the value \[x=-3\].
The line will be a solid line because inequality includes the value \[x=3\].
The inequality \[x<-3\] says we need to consider the values which are less than -3. That means we have to shade the part to the left of -3.
The inequality \[x\ge 3\] says that we need to consider the values which are greater than and equal to 3. This means we have to shade the part to the right of 3.
The below graph shows the inequalities \[x<-3\],\[x\ge 3\]:
Note:
In order to solve these types of problems, we need to have knowledge of inequalities and how to plot a graph of inequality. while solving inequalities check which inequality is given carefully to avoid mistakes. We have to check which part to be shaded depending on the inequality given in the problem. We should avoid calculation mistakes to get the correct solution.
Recently Updated Pages
Master Class 10 Computer Science: Engaging Questions & Answers for Success
Master Class 10 General Knowledge: Engaging Questions & Answers for Success
Master Class 10 English: Engaging Questions & Answers for Success
Master Class 10 Social Science: Engaging Questions & Answers for Success
Master Class 10 Maths: Engaging Questions & Answers for Success
Master Class 10 Science: Engaging Questions & Answers for Success
Trending doubts
What is the median of the first 10 natural numbers class 10 maths CBSE
Which women's tennis player has 24 Grand Slam singles titles?
Who is the Brand Ambassador of Incredible India?
Why is there a time difference of about 5 hours between class 10 social science CBSE
Write a letter to the principal requesting him to grant class 10 english CBSE
State and prove converse of BPT Basic Proportionality class 10 maths CBSE