


How do you graph \[x = 2\] by plotting points?
Answer
481.5k+ views
Hint: To solve this question first we have to show that this equation is independent of two variables that are x and \[y\]. Then we assume some points and tell them that on joining these points we get a graph of the given equation. and we have to explain how we make graphs in 2-D, not in 3-D.
Complete step-by-step answer:
We have given an equation \[x = 2\].
We are told how we draw the graph of the equation \[x = 2\].
For making the graph we have to find some points and then join them.
\[x = 2\] is the given equation which is free from the variable \[y\] and \[z\].
So if we put any point in place of \[y\] and \[z\] then there is no effect on the x variable.
We have to make a graph in the 2-D plane so we will not put the \[z\] variable and mark some points on x and \[y\].
So the points are-
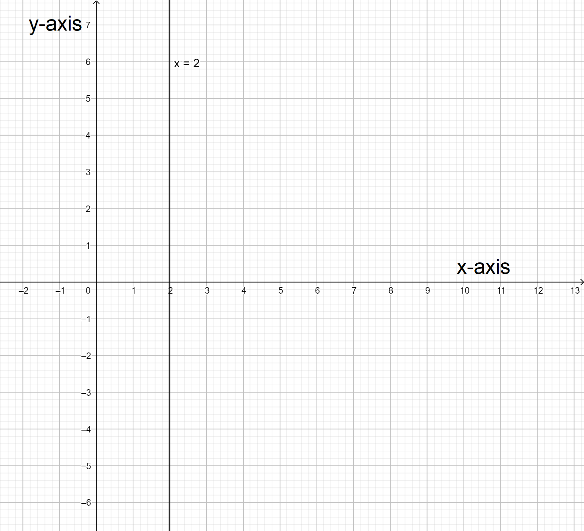
(2,8), (2,-1), (2,0) and (2,6)
The graph of the given equation is.
Final answer:
According to the points, the graph of the line \[x = 2\] is a vertical line passing through 2 on the x-axis.
Note: Although this is a very easy question we have to know some points. If we show a variable equal to any constant number on a number line then that is a point. If we show that in a plane then that is a line. And if we show that in 3D view then that is a plane. Minimum two numbers are required to make a line.
Complete step-by-step answer:
We have given an equation \[x = 2\].
We are told how we draw the graph of the equation \[x = 2\].
For making the graph we have to find some points and then join them.
\[x = 2\] is the given equation which is free from the variable \[y\] and \[z\].
So if we put any point in place of \[y\] and \[z\] then there is no effect on the x variable.
We have to make a graph in the 2-D plane so we will not put the \[z\] variable and mark some points on x and \[y\].
So the points are-
(2,8), (2,-1), (2,0) and (2,6)
The graph of the given equation is.
Final answer:
According to the points, the graph of the line \[x = 2\] is a vertical line passing through 2 on the x-axis.
Note: Although this is a very easy question we have to know some points. If we show a variable equal to any constant number on a number line then that is a point. If we show that in a plane then that is a line. And if we show that in 3D view then that is a plane. Minimum two numbers are required to make a line.
Recently Updated Pages
Master Class 11 Computer Science: Engaging Questions & Answers for Success
Master Class 11 Business Studies: Engaging Questions & Answers for Success
Master Class 11 Economics: Engaging Questions & Answers for Success
Master Class 11 English: Engaging Questions & Answers for Success
Master Class 11 Maths: Engaging Questions & Answers for Success
Master Class 11 Biology: Engaging Questions & Answers for Success
Trending doubts
One Metric ton is equal to kg A 10000 B 1000 C 100 class 11 physics CBSE
There are 720 permutations of the digits 1 2 3 4 5 class 11 maths CBSE
Discuss the various forms of bacteria class 11 biology CBSE
Draw a diagram of a plant cell and label at least eight class 11 biology CBSE
State the laws of reflection of light
Explain zero factorial class 11 maths CBSE