


How do you graph \[x = {y^2} - 2y\] using a table of values?
Answer
545.7k+ views
Hint: We need to draw the graph ‘x’ versus ‘y’. We give the random values for ‘x’ and we find the value of ‘y’. We can give all real numbers for the value of ‘x’. Thus we will have coordinate points (x, y). Hence, we can plot the graph by using the values. We can also draw the graph using the intercept method. But here we have a function which is passing through origin. So we use tables to draw the graph.
Complete step-by-step answer:
Given \[x = {y^2} - 2y\] .
Rearranging the equation we have
\[y = 1 - x\]
Let's give the values for ‘x’ and we find the value of ‘y’.
Put \[x = 1\] in \[x = {y^2} - 2y\] we have,
\[1 = {y^2} - 2y\]
\[{y^2} - 2y - 1 = 0\]
We use quadratic formula \[y = \dfrac{{ - b \pm \sqrt {{b^2} - 4ac} }}{{2a}}\] , where \[a = 1\] , \[b = - 2\] and \[c = - 1\] .
\[y = \dfrac{{ - ( - 2) \pm \sqrt {{{( - 2)}^2} - 4(1)( - 1)} }}{{2(1)}}\]
\[y = \dfrac{{2 \pm \sqrt {4 + 4} }}{2}\]
\[y = \dfrac{{2 \pm \sqrt 8 }}{2}\]
\[y = \dfrac{{2 \pm \sqrt {4 \times 2} }}{2}\]
\[y = \dfrac{{2 \pm 2\sqrt 2 }}{2}\]
\[y = \dfrac{{2\left( {1 \pm \sqrt 2 } \right)}}{2}\]
\[y = 1 \pm \sqrt 2 \]
That is
\[ \Rightarrow y = 1 + \sqrt 2 \] and \[y = 1 - \sqrt 2 \]
\[ \Rightarrow y = 1 + 1.414\] and \[y = 1 - 1.414\]
\[ \Rightarrow y = 2.414\] and \[y = - 0.414\]
Rounding off the decimal points we have
\[ \Rightarrow y = 2.41\] and \[y = - 0.41\]
Thus we have coordinate point \[(1,2.41)\] and \[(1, - 0.41)\] .
Put \[x = - 1\] in \[x = {y^2} - 2y\] we have,
\[ - 1 = {y^2} - 2y\]
\[{y^2} - 2y + 1 = 0\]
This is of the form \[{a^2} - 2ab + {b^2} = {(a - b)^2}\] , where \[a = y\] and \[b = 1\] .
\[{(y - 1)^2} = 0\]
Thus we have
\[ \Rightarrow y = 1,1\]
Thus we have coordinate point \[( - 1,1)\] .
Put \[x = 2\] in \[x = {y^2} - 2y\] we have,
\[2 = {y^2} - 2y\]
\[{y^2} - 2y - 2 = 0\]
We use quadratic formula \[y = \dfrac{{ - b \pm \sqrt {{b^2} - 4ac} }}{{2a}}\] , where \[a = 1\] , \[b = - 2\] and \[c = - 2\] .
\[y = \dfrac{{ - ( - 2) \pm \sqrt {{{( - 2)}^2} - 4(1)( - 2)} }}{{2(1)}}\]
\[y = \dfrac{{2 \pm \sqrt {4 + 8} }}{2}\]
\[y = \dfrac{{2 \pm \sqrt {12} }}{2}\]
\[y = \dfrac{{2 \pm \sqrt {4 \times 3} }}{2}\]
\[y = \dfrac{{2 \pm 2\sqrt 3 }}{2}\]
\[y = \dfrac{{2\left( {1 \pm \sqrt 3 } \right)}}{2}\]
\[y = 1 \pm \sqrt 3 \]
That is
\[ \Rightarrow y = 1 + \sqrt 3 \] and \[y = 1 - \sqrt 3 \]
\[ \Rightarrow y = 1 + 1.732\] and \[y = 1 - 1.732\]
\[ \Rightarrow y = 2.732\] and \[y = - 0.732\]
Round off the decimal point we have,
\[ \Rightarrow y = 2.73\] and \[y = - 0.73\]
Thus we have coordinate points \[(2,2.73)\] and \[(2, - 0.73)\] .
Thus we have,
Let’s draw the graph for these coordinates,
Note: A graph shows the relation between two variable quantities, it contains two axes perpendicular to each other namely the x-axis and the y-axis. Each variable is measured along one of the axes. In the question, we are given one linear equation containing two variables namely x and y, x is measured along the x-axis and y is measured along the y-axis while tracing the given equations.
Complete step-by-step answer:
Given \[x = {y^2} - 2y\] .
Rearranging the equation we have
\[y = 1 - x\]
Let's give the values for ‘x’ and we find the value of ‘y’.
Put \[x = 1\] in \[x = {y^2} - 2y\] we have,
\[1 = {y^2} - 2y\]
\[{y^2} - 2y - 1 = 0\]
We use quadratic formula \[y = \dfrac{{ - b \pm \sqrt {{b^2} - 4ac} }}{{2a}}\] , where \[a = 1\] , \[b = - 2\] and \[c = - 1\] .
\[y = \dfrac{{ - ( - 2) \pm \sqrt {{{( - 2)}^2} - 4(1)( - 1)} }}{{2(1)}}\]
\[y = \dfrac{{2 \pm \sqrt {4 + 4} }}{2}\]
\[y = \dfrac{{2 \pm \sqrt 8 }}{2}\]
\[y = \dfrac{{2 \pm \sqrt {4 \times 2} }}{2}\]
\[y = \dfrac{{2 \pm 2\sqrt 2 }}{2}\]
\[y = \dfrac{{2\left( {1 \pm \sqrt 2 } \right)}}{2}\]
\[y = 1 \pm \sqrt 2 \]
That is
\[ \Rightarrow y = 1 + \sqrt 2 \] and \[y = 1 - \sqrt 2 \]
\[ \Rightarrow y = 1 + 1.414\] and \[y = 1 - 1.414\]
\[ \Rightarrow y = 2.414\] and \[y = - 0.414\]
Rounding off the decimal points we have
\[ \Rightarrow y = 2.41\] and \[y = - 0.41\]
Thus we have coordinate point \[(1,2.41)\] and \[(1, - 0.41)\] .
Put \[x = - 1\] in \[x = {y^2} - 2y\] we have,
\[ - 1 = {y^2} - 2y\]
\[{y^2} - 2y + 1 = 0\]
This is of the form \[{a^2} - 2ab + {b^2} = {(a - b)^2}\] , where \[a = y\] and \[b = 1\] .
\[{(y - 1)^2} = 0\]
Thus we have
\[ \Rightarrow y = 1,1\]
Thus we have coordinate point \[( - 1,1)\] .
Put \[x = 2\] in \[x = {y^2} - 2y\] we have,
\[2 = {y^2} - 2y\]
\[{y^2} - 2y - 2 = 0\]
We use quadratic formula \[y = \dfrac{{ - b \pm \sqrt {{b^2} - 4ac} }}{{2a}}\] , where \[a = 1\] , \[b = - 2\] and \[c = - 2\] .
\[y = \dfrac{{ - ( - 2) \pm \sqrt {{{( - 2)}^2} - 4(1)( - 2)} }}{{2(1)}}\]
\[y = \dfrac{{2 \pm \sqrt {4 + 8} }}{2}\]
\[y = \dfrac{{2 \pm \sqrt {12} }}{2}\]
\[y = \dfrac{{2 \pm \sqrt {4 \times 3} }}{2}\]
\[y = \dfrac{{2 \pm 2\sqrt 3 }}{2}\]
\[y = \dfrac{{2\left( {1 \pm \sqrt 3 } \right)}}{2}\]
\[y = 1 \pm \sqrt 3 \]
That is
\[ \Rightarrow y = 1 + \sqrt 3 \] and \[y = 1 - \sqrt 3 \]
\[ \Rightarrow y = 1 + 1.732\] and \[y = 1 - 1.732\]
\[ \Rightarrow y = 2.732\] and \[y = - 0.732\]
Round off the decimal point we have,
\[ \Rightarrow y = 2.73\] and \[y = - 0.73\]
Thus we have coordinate points \[(2,2.73)\] and \[(2, - 0.73)\] .
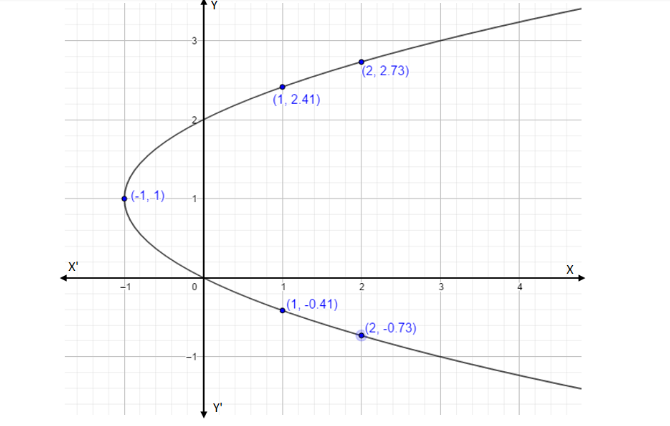
Thus we have,
| \[x\] | \[1\] | \[1\] | \[ - 1\] | \[2\] | \[2\] |
| \[y\] | \[2.41\] | \[ - 0.41\] | \[1\] | \[2.73\] | \[ - 0.73\] |
Let’s draw the graph for these coordinates,
Note: A graph shows the relation between two variable quantities, it contains two axes perpendicular to each other namely the x-axis and the y-axis. Each variable is measured along one of the axes. In the question, we are given one linear equation containing two variables namely x and y, x is measured along the x-axis and y is measured along the y-axis while tracing the given equations.
Recently Updated Pages
Master Class 8 Social Science: Engaging Questions & Answers for Success
Master Class 8 English: Engaging Questions & Answers for Success
Class 8 Question and Answer - Your Ultimate Solutions Guide
Master Class 8 Maths: Engaging Questions & Answers for Success
Master Class 8 Science: Engaging Questions & Answers for Success
Master Class 9 General Knowledge: Engaging Questions & Answers for Success
Trending doubts
What are the 12 elements of nature class 8 chemistry CBSE
What is the difference between rai and mustard see class 8 biology CBSE
When people say No pun intended what does that mea class 8 english CBSE
Write a short biography of Dr APJ Abdul Kalam under class 8 english CBSE
Write a letter to the Municipal Commissioner to inform class 8 english CBSE
Compare the manure and fertilizer in maintaining the class 8 biology CBSE