


How do you graph \[x-y=1\] by plotting points?
Answer
541.8k+ views
Hint: From the question we have been asked to find the graph of a function with the help of table of values. To solve this question we will find the points on the graph using the substitution method. We will substitute a value for x and find the corresponding value of the y from the function \[x-y=1\]. From those points which we found using the substitution method using them we will plot the graph.
Complete step by step solution:
Firstly, we will find the points on the graph by substituting x value in the given function which is \[x-y=1\].
So, now we will substitute \[x=1\] in the function and find the value of y. so, we get,
\[\Rightarrow x-y=1\]
\[\Rightarrow 1-y=1\]
\[\Rightarrow y=0\]
So, we got the point as \[\left( 1,0 \right)\].
Similarly we will find another set of points so that it helps us to graph easily.
So, now we will substitute the value of x as \[x=0\]. So, we get,
\[\Rightarrow x-y=1\]
\[\Rightarrow 0-y=1\]
\[\Rightarrow y=-1\]
So, we got the point as \[\left( 0,-1 \right)\].
Now, we will substitute the value of x as \[x=2\]. So, we get,
\[\Rightarrow x-y=1\]
\[\Rightarrow 2-y=1\]
\[\Rightarrow y=1\]
So, we got the corresponding point as \[\left( 2,1 \right)\].
Now, we will substitute the value of x as \[x=3\]. So, we get,
\[\Rightarrow x-y=1\]
\[\Rightarrow 3-y=1\]
\[\Rightarrow y=2\]
So, we got the point as \[\left( 3,2 \right)\].
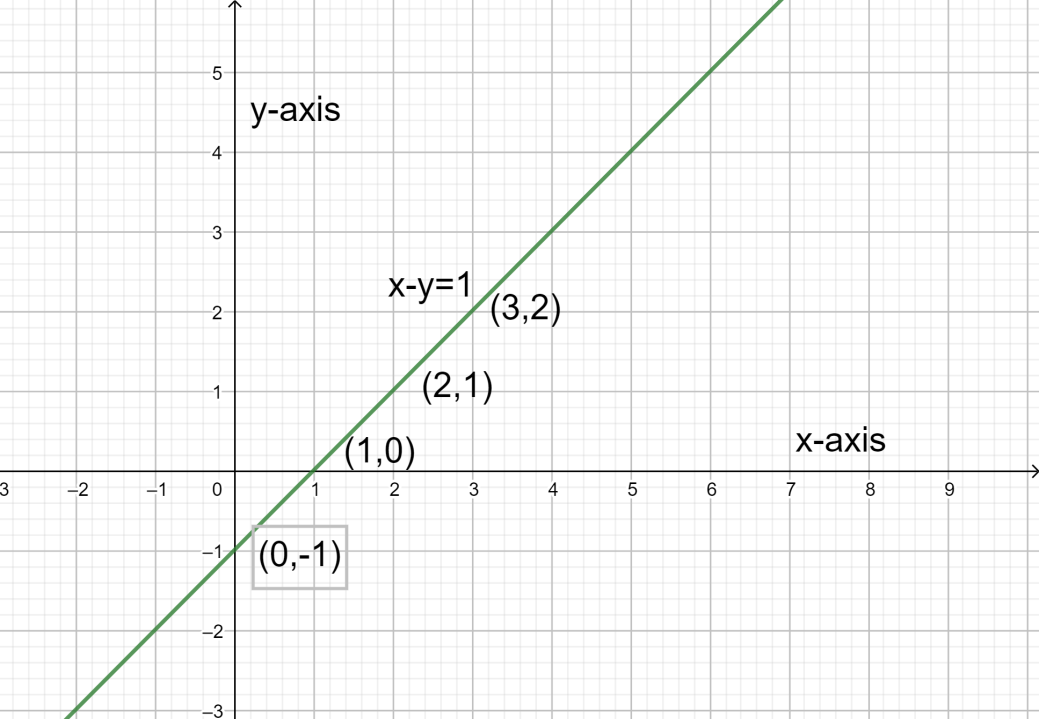
So, the points we plotted are \[\left( 1,0 \right)\], \[\left( 0,-1 \right)\],\[\left( 2,1 \right)\],\[\left( 3,2 \right)\].
We will take the help of these points and we will draw the graph.
Therefore, the graph of the given question will be as follows.
Note: Students should not do any calculation mistakes. Students must have good knowledge in this substitution method and finding the points on a graph using a given function. Students should not make mistakes in taking the point wrong for example in the first case if we take the point as \[\left( 0,1 \right)\] instead of \[\left( 1,0 \right)\] our solution will be wrong.
Complete step by step solution:
Firstly, we will find the points on the graph by substituting x value in the given function which is \[x-y=1\].
So, now we will substitute \[x=1\] in the function and find the value of y. so, we get,
\[\Rightarrow x-y=1\]
\[\Rightarrow 1-y=1\]
\[\Rightarrow y=0\]
So, we got the point as \[\left( 1,0 \right)\].
Similarly we will find another set of points so that it helps us to graph easily.
So, now we will substitute the value of x as \[x=0\]. So, we get,
\[\Rightarrow x-y=1\]
\[\Rightarrow 0-y=1\]
\[\Rightarrow y=-1\]
So, we got the point as \[\left( 0,-1 \right)\].
Now, we will substitute the value of x as \[x=2\]. So, we get,
\[\Rightarrow x-y=1\]
\[\Rightarrow 2-y=1\]
\[\Rightarrow y=1\]
So, we got the corresponding point as \[\left( 2,1 \right)\].
Now, we will substitute the value of x as \[x=3\]. So, we get,
\[\Rightarrow x-y=1\]
\[\Rightarrow 3-y=1\]
\[\Rightarrow y=2\]
So, we got the point as \[\left( 3,2 \right)\].
So, the points we plotted are \[\left( 1,0 \right)\], \[\left( 0,-1 \right)\],\[\left( 2,1 \right)\],\[\left( 3,2 \right)\].
We will take the help of these points and we will draw the graph.
Therefore, the graph of the given question will be as follows.
Note: Students should not do any calculation mistakes. Students must have good knowledge in this substitution method and finding the points on a graph using a given function. Students should not make mistakes in taking the point wrong for example in the first case if we take the point as \[\left( 0,1 \right)\] instead of \[\left( 1,0 \right)\] our solution will be wrong.
Recently Updated Pages
Master Class 9 General Knowledge: Engaging Questions & Answers for Success
Master Class 9 Social Science: Engaging Questions & Answers for Success
Master Class 9 English: Engaging Questions & Answers for Success
Master Class 9 Maths: Engaging Questions & Answers for Success
Master Class 9 Science: Engaging Questions & Answers for Success
Class 9 Question and Answer - Your Ultimate Solutions Guide
Trending doubts
Difference Between Plant Cell and Animal Cell
Fill the blanks with the suitable prepositions 1 The class 9 english CBSE
Who is eligible for RTE class 9 social science CBSE
Which places in India experience sunrise first and class 9 social science CBSE
What is pollution? How many types of pollution? Define it
Name 10 Living and Non living things class 9 biology CBSE