


How do I graph $y-2=0$?
Answer
559.5k+ views
Hint: First we will solve the given equation to find the value of y-coordinate. Then we find the value of x-coordinate and then plot the obtained points on the graph step by step.
Complete step by step answer:
We have been given an equation $y-2=0$.
We have to plot a graph by using the given equation.
Now, let us first solve the given equation for y, then we will get
$\begin{align}
& \Rightarrow y-2=0 \\
& \Rightarrow y=2 \\
\end{align}$
The above equation says that y=2 is satisfied for each and every value of x.
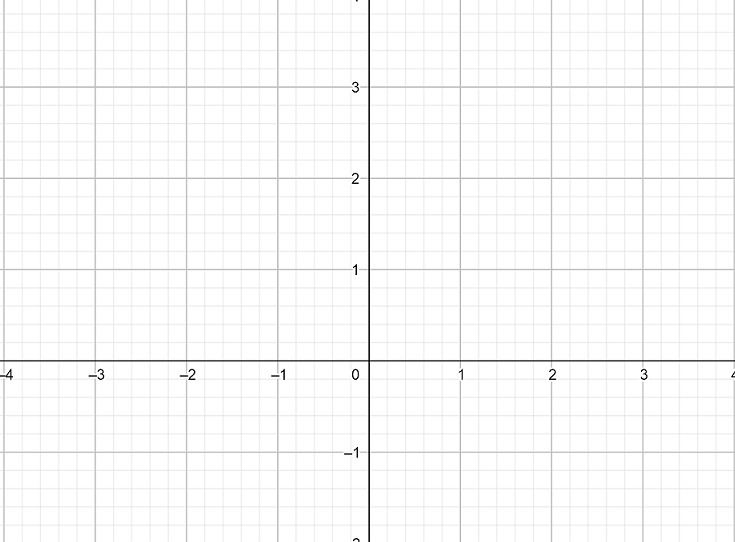
To plot a point on the graph first we need to draw an axis. Let us draw X axis and Y axis on the graph and mark the units by taking 1 unit for each box. Then we will get
Now we can draw a horizontal line parallel to X-axis which is 2 blocks up from the origin and perpendicular to Y-axis. Then we will get
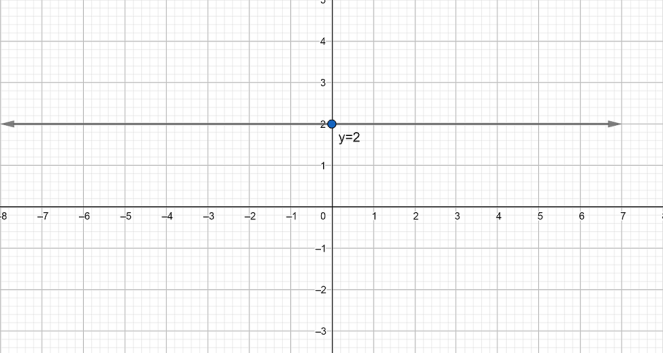
Hence the above is the required graph for the equation $y-2=0$.
Note: The general form of the equation of straight line is $ax+by+c=0$. We can substitute the different values of x in the given equation and check whether it will satisfy the equation or not.
First let us rewrite the equation in the standard form, then we will get
$\Rightarrow 0.x+y-2=0$
Let us substitute $x=0$ in the above equation, then we will get
$\begin{align}
& \Rightarrow 0.0+y-2=0 \\
& \Rightarrow y-2=0 \\
& \Rightarrow y=2 \\
\end{align}$
Let us substitute $x=2$ in the above equation, then we will get
$\begin{align}
& \Rightarrow 0.2+y-2=0 \\
& \Rightarrow y-2=0 \\
& \Rightarrow y=2 \\
\end{align}$
Let us substitute $x=3$ in the above equation, then we will get
$\begin{align}
& \Rightarrow 0.3+y-2=0 \\
& \Rightarrow y-2=0 \\
& \Rightarrow y=2 \\
\end{align}$
It means that x-coordinate can take any value without affecting the original function. So the given equation represents a horizontal line parallel to X-axis.
Complete step by step answer:
We have been given an equation $y-2=0$.
We have to plot a graph by using the given equation.
Now, let us first solve the given equation for y, then we will get
$\begin{align}
& \Rightarrow y-2=0 \\
& \Rightarrow y=2 \\
\end{align}$
The above equation says that y=2 is satisfied for each and every value of x.
To plot a point on the graph first we need to draw an axis. Let us draw X axis and Y axis on the graph and mark the units by taking 1 unit for each box. Then we will get
Now we can draw a horizontal line parallel to X-axis which is 2 blocks up from the origin and perpendicular to Y-axis. Then we will get
Hence the above is the required graph for the equation $y-2=0$.
Note: The general form of the equation of straight line is $ax+by+c=0$. We can substitute the different values of x in the given equation and check whether it will satisfy the equation or not.
First let us rewrite the equation in the standard form, then we will get
$\Rightarrow 0.x+y-2=0$
Let us substitute $x=0$ in the above equation, then we will get
$\begin{align}
& \Rightarrow 0.0+y-2=0 \\
& \Rightarrow y-2=0 \\
& \Rightarrow y=2 \\
\end{align}$
Let us substitute $x=2$ in the above equation, then we will get
$\begin{align}
& \Rightarrow 0.2+y-2=0 \\
& \Rightarrow y-2=0 \\
& \Rightarrow y=2 \\
\end{align}$
Let us substitute $x=3$ in the above equation, then we will get
$\begin{align}
& \Rightarrow 0.3+y-2=0 \\
& \Rightarrow y-2=0 \\
& \Rightarrow y=2 \\
\end{align}$
It means that x-coordinate can take any value without affecting the original function. So the given equation represents a horizontal line parallel to X-axis.
Recently Updated Pages
Master Class 8 Social Science: Engaging Questions & Answers for Success
Master Class 8 English: Engaging Questions & Answers for Success
Class 8 Question and Answer - Your Ultimate Solutions Guide
Master Class 8 Maths: Engaging Questions & Answers for Success
Master Class 8 Science: Engaging Questions & Answers for Success
Master Class 9 General Knowledge: Engaging Questions & Answers for Success
Trending doubts
What is BLO What is the full form of BLO class 8 social science CBSE
Citizens of India can vote at the age of A 18 years class 8 social science CBSE
Full form of STD, ISD and PCO
Advantages and disadvantages of science
Right to vote is a AFundamental Right BFundamental class 8 social science CBSE
What are the 12 elements of nature class 8 chemistry CBSE