


How do you graph $3x - y < 0$?
Answer
558.6k+ views
Hint: Given a linear equation and we have to plot a graph of the equation. To plot the graph of the equation, first, we will write the equation for one variable. Then write the corresponding equation by replacing the less than symbol with equal symbol. Then determine the value of one variable y by substituting different values of x. Then the set of these values can be plotted on the set of axes. Then we will join the points to obtain the graph of the equation. Now we will shade the required area according to the symbol.
Complete step-by-step answer:
We are given the equation $3x - y < 0$. Subtract $3x$ from both sides of the equation.
$3x - y - 3x < 0 - 3x$
$ \Rightarrow - y < - 3x$
Now, divide both sides of the equation by $ - 1$ and reverse the inequality symbol.
$ \Rightarrow \dfrac{{ - y}}{{ - 1}} > \dfrac{{ - 3x}}{{ - 1}}$
$ \Rightarrow y > 3x$
Now we will find the corresponding equation by replacing the symbol $ > $ with an equal to symbol.
$ \Rightarrow y = 3x$
Now, we will find the values of $y$ for different values of $x$. So, create a table to write the different ordered pairs of the equation.
Now, write the intercepts of the equation in the form of ordered pairs.
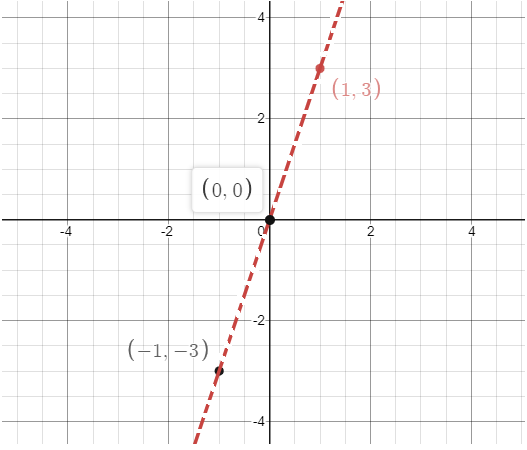
$\left( {0,0} \right)$, $\left( { - 1, - 3} \right)$ and $\left( {1,3} \right)$
Now we will plot the points on the set of $x$-axis and $y$-axis. Then join these points using a dashed line to show that the points are not included in the graph of inequality because the equation contains symbol $ > $.
Now, shade the region above the line to represent the inequality $y > 3x$ which means the points greater than $y = 3x$ are included in the graph.
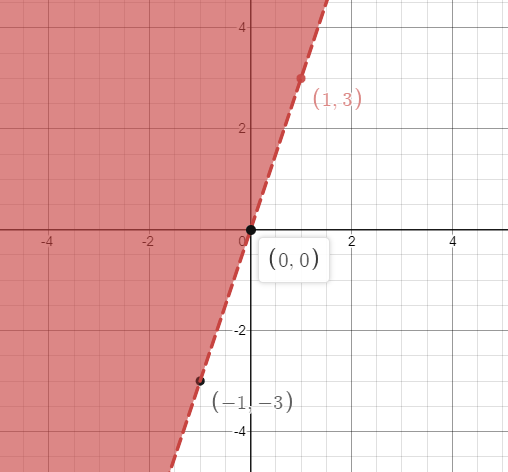
Final answer: Hence the graph of the equation is

Note:
In such types of questions students mainly make mistakes while plotting the points on the set of axes. In an ordered pair$\left( {x,y} \right)$, the value of $x$ is the distance of the point from $y$-axis whereas the value of $y$ is plotted by taking the distance from the $x$-axis. In such types of questions, the graph of a polynomial is obtained by plotting these points and must be in a straight line.
Complete step-by-step answer:
We are given the equation $3x - y < 0$. Subtract $3x$ from both sides of the equation.
$3x - y - 3x < 0 - 3x$
$ \Rightarrow - y < - 3x$
Now, divide both sides of the equation by $ - 1$ and reverse the inequality symbol.
$ \Rightarrow \dfrac{{ - y}}{{ - 1}} > \dfrac{{ - 3x}}{{ - 1}}$
$ \Rightarrow y > 3x$
Now we will find the corresponding equation by replacing the symbol $ > $ with an equal to symbol.
$ \Rightarrow y = 3x$
Now, we will find the values of $y$ for different values of $x$. So, create a table to write the different ordered pairs of the equation.
| $x$ | $ - 1$ | $0$ | $1$ |
| $y = 3x$ | $ - 3$ | $0$ | $3$ |
Now, write the intercepts of the equation in the form of ordered pairs.
$\left( {0,0} \right)$, $\left( { - 1, - 3} \right)$ and $\left( {1,3} \right)$
Now we will plot the points on the set of $x$-axis and $y$-axis. Then join these points using a dashed line to show that the points are not included in the graph of inequality because the equation contains symbol $ > $.
Now, shade the region above the line to represent the inequality $y > 3x$ which means the points greater than $y = 3x$ are included in the graph.
Final answer: Hence the graph of the equation is
Note:
In such types of questions students mainly make mistakes while plotting the points on the set of axes. In an ordered pair$\left( {x,y} \right)$, the value of $x$ is the distance of the point from $y$-axis whereas the value of $y$ is plotted by taking the distance from the $x$-axis. In such types of questions, the graph of a polynomial is obtained by plotting these points and must be in a straight line.
Recently Updated Pages
Master Class 12 Economics: Engaging Questions & Answers for Success
Master Class 12 Physics: Engaging Questions & Answers for Success
Master Class 12 English: Engaging Questions & Answers for Success
Master Class 12 Social Science: Engaging Questions & Answers for Success
Master Class 12 Maths: Engaging Questions & Answers for Success
Master Class 12 Business Studies: Engaging Questions & Answers for Success
Trending doubts
Which are the Top 10 Largest Countries of the World?
What are the major means of transport Explain each class 12 social science CBSE
Draw a labelled sketch of the human eye class 12 physics CBSE
What is a transformer Explain the principle construction class 12 physics CBSE
Why cannot DNA pass through cell membranes class 12 biology CBSE
Differentiate between insitu conservation and exsitu class 12 biology CBSE