


How do you graph $\dfrac{7}{2x-2}$?
Answer
546.6k+ views
Hint: We first explain the curve for the rectangular hyperbola. Then we place the values and different signs for $x$ and $y$ coordinates in the function $y=\dfrac{7}{2x-2}$. We tried to find the characteristics for the graph and then plot the graph.
Complete step-by-step solution:
The given equation of $y=\dfrac{7}{2x-2}$ is an example of rectangular hyperbola.
A hyperbola for which the asymptotes are perpendicular, also called an equilateral hyperbola or right hyperbola. This occurs when the semimajor and semi minor axes are equal. This corresponds to taking, giving eccentricity.
We can find the graph of the hyperbola using the values separately.
We try to find the signs for the $x$ and $y$ coordinates.
We take $x>1$ which gives $y>0$. Similarly, if we take $x<1$, then that will give $y<0$.
The quadrants solving the conditions are the first and third quadrant.
Now we try to find the values for $x$ and $y$ coordinates.
If the value of $x$ increases, the value of $y$ decreases because of the inverse relation.
Similarly, if the value of $y$ increases, the value of $x$ decreases.
The value of $y$ can never be 0. The limiting values will be 0.
Now based on the information, we draw the graph.
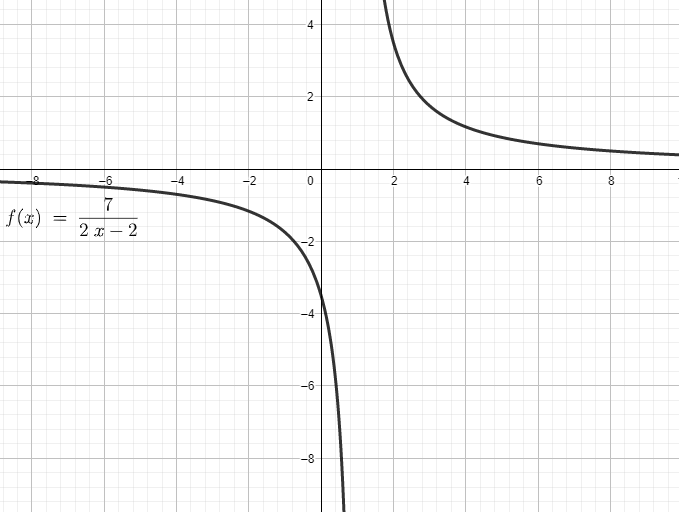
Note: We need to remember that the limiting values for the function $y=\dfrac{7}{2x-2}$.
The value of $y$ in the function $y=\dfrac{7}{2x-2}$ tends to $\pm \infty $ as $x\to 1$.
The value of $y$ in the function $y=\dfrac{7}{2x-2}$ tends to 0 as $x\to \pm \infty $.
Complete step-by-step solution:
The given equation of $y=\dfrac{7}{2x-2}$ is an example of rectangular hyperbola.
A hyperbola for which the asymptotes are perpendicular, also called an equilateral hyperbola or right hyperbola. This occurs when the semimajor and semi minor axes are equal. This corresponds to taking, giving eccentricity.
We can find the graph of the hyperbola using the values separately.
We try to find the signs for the $x$ and $y$ coordinates.
We take $x>1$ which gives $y>0$. Similarly, if we take $x<1$, then that will give $y<0$.
The quadrants solving the conditions are the first and third quadrant.
Now we try to find the values for $x$ and $y$ coordinates.
If the value of $x$ increases, the value of $y$ decreases because of the inverse relation.
Similarly, if the value of $y$ increases, the value of $x$ decreases.
The value of $y$ can never be 0. The limiting values will be 0.
Now based on the information, we draw the graph.
Note: We need to remember that the limiting values for the function $y=\dfrac{7}{2x-2}$.
The value of $y$ in the function $y=\dfrac{7}{2x-2}$ tends to $\pm \infty $ as $x\to 1$.
The value of $y$ in the function $y=\dfrac{7}{2x-2}$ tends to 0 as $x\to \pm \infty $.
Recently Updated Pages
Master Class 11 English: Engaging Questions & Answers for Success
Master Class 11 Maths: Engaging Questions & Answers for Success
Master Class 11 Biology: Engaging Questions & Answers for Success
Master Class 11 Physics: Engaging Questions & Answers for Success
Master Class 11 Accountancy: Engaging Questions & Answers for Success
Class 11 Question and Answer - Your Ultimate Solutions Guide
Trending doubts
One Metric ton is equal to kg A 10000 B 1000 C 100 class 11 physics CBSE
Discuss the various forms of bacteria class 11 biology CBSE
Draw a diagram of a plant cell and label at least eight class 11 biology CBSE
State the laws of reflection of light
Explain zero factorial class 11 maths CBSE
10 examples of friction in our daily life