


How do you graph the inequality x > -4?
Answer
558.3k+ views
Hint: We will first understand the method to draw the graph of inequality and then we will plot the inequality x > -4. We will first plot the line x = 4 and since the inequality x > -4 says that we have to select all the values greater than x = -4 so all the graph portion to the right of the line x = -4 will be selected.
Complete step by step answer:
We will first understand the method of how to draw the graph of a linear inequality in two variables. Suppose we are given a linear inequality ax + by > c.
At first, we will draw the equation of line ax + by = c by bringing all the terms involving variables on the left and all the terms involving other variables on the right. After that we will have the inequality of the form $y < f\left( x \right)\text{or }y > f\left( x \right)$.
If we have greater than sign then all the part of the graph above and to the right of the line will be required and if we have smaller than sign then all the part of the graph below and left will be our required portion.
Since we have to graph the inequality x > -4.
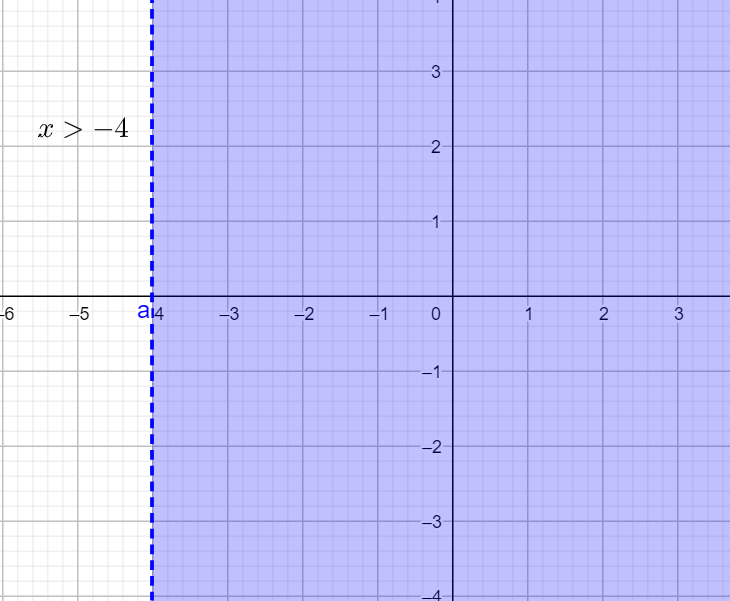
So, at first, we will draw the equation of the line x = -4
We can see that we do not have y terms in the equation x = -4. So, the slope of the line will be infinite and we will have a line parallel to the y-axis.
Now, since the inequality says that we have to select all the portions of the graph which have x value greater than -4.
So, the portion of the graph to the right of line x = -4 will be our required graph as we have to graph the inequality x > -4.
Note:
When we have to draw the graph of inequality we are first required to convert the given inequality in the form $y < f\left( x \right)\text{or }y > f\left( x \right)$, and then draw the graph of equation y = f(x) and then we will check the required portion of the graph by putting some values of x and y and the portion for which x and y satisfy the inequality will be our required answer.
Complete step by step answer:
We will first understand the method of how to draw the graph of a linear inequality in two variables. Suppose we are given a linear inequality ax + by > c.
At first, we will draw the equation of line ax + by = c by bringing all the terms involving variables on the left and all the terms involving other variables on the right. After that we will have the inequality of the form $y < f\left( x \right)\text{or }y > f\left( x \right)$.
If we have greater than sign then all the part of the graph above and to the right of the line will be required and if we have smaller than sign then all the part of the graph below and left will be our required portion.
Since we have to graph the inequality x > -4.
So, at first, we will draw the equation of the line x = -4
We can see that we do not have y terms in the equation x = -4. So, the slope of the line will be infinite and we will have a line parallel to the y-axis.
Now, since the inequality says that we have to select all the portions of the graph which have x value greater than -4.
So, the portion of the graph to the right of line x = -4 will be our required graph as we have to graph the inequality x > -4.
Note:
When we have to draw the graph of inequality we are first required to convert the given inequality in the form $y < f\left( x \right)\text{or }y > f\left( x \right)$, and then draw the graph of equation y = f(x) and then we will check the required portion of the graph by putting some values of x and y and the portion for which x and y satisfy the inequality will be our required answer.
Recently Updated Pages
Master Class 10 Computer Science: Engaging Questions & Answers for Success
Master Class 10 General Knowledge: Engaging Questions & Answers for Success
Master Class 10 English: Engaging Questions & Answers for Success
Master Class 10 Social Science: Engaging Questions & Answers for Success
Master Class 10 Maths: Engaging Questions & Answers for Success
Master Class 10 Science: Engaging Questions & Answers for Success
Trending doubts
What is the median of the first 10 natural numbers class 10 maths CBSE
Which women's tennis player has 24 Grand Slam singles titles?
Who is the Brand Ambassador of Incredible India?
Why is there a time difference of about 5 hours between class 10 social science CBSE
Write a letter to the principal requesting him to grant class 10 english CBSE
A moving boat is observed from the top of a 150 m high class 10 maths CBSE