


How do you graph the line $x - 2y = 4$?
Answer
493.8k+ views
Hint: In the given question, we have to draw the graph for the line whose equation is provided to us in the question itself. So, we first find some points lying on the straight line and make a table of coordinates of the points. Then, we plot these points on the graph and the line passing through them.
Complete step-by-step answer:
Here in this question, we have to plot the graph for the given equation $x - 2y = 4$.
First, we have to find the value of y by using the graph equation $x - 2y = 4$. Let us substitute the value of x as $0$, $2$, and $4$.
Now we consider the value of x as $0$, the value of y is
$ \Rightarrow 0 - 2y = 4$
$ \Rightarrow y = \dfrac{4}{{ - 2}} = - 2$
Now we consider the value of x as $2$, the value of y is
$ \Rightarrow 2 - 2y = 4$
$ \Rightarrow - 2y = 4 - 2$
$ \Rightarrow y = \dfrac{2}{{ - 2}} = - 1$
Now we consider the value of x as $4$, the value of y is
$ \Rightarrow 4 - 2y = 4$
$ \Rightarrow - 2y = 4 - 4$
$ \Rightarrow - 2y = 0$
$ \Rightarrow y = 0$
Now we draw a table for these values we have
The graph plotted for these point is represented below:
Note: The graph has two axes: x-axis and y-axis. X-axis is the horizontal axis and the y-axis is the vertical axis. The slope of the line is denoted by ‘m’ and tells the rate of change of y with respect to x. y is the dependent variable and x is the independent variable. The graph that we have plotted has a scale of one unit square representing one unit.
Complete step-by-step answer:
Here in this question, we have to plot the graph for the given equation $x - 2y = 4$.
First, we have to find the value of y by using the graph equation $x - 2y = 4$. Let us substitute the value of x as $0$, $2$, and $4$.
Now we consider the value of x as $0$, the value of y is
$ \Rightarrow 0 - 2y = 4$
$ \Rightarrow y = \dfrac{4}{{ - 2}} = - 2$
Now we consider the value of x as $2$, the value of y is
$ \Rightarrow 2 - 2y = 4$
$ \Rightarrow - 2y = 4 - 2$
$ \Rightarrow y = \dfrac{2}{{ - 2}} = - 1$
Now we consider the value of x as $4$, the value of y is
$ \Rightarrow 4 - 2y = 4$
$ \Rightarrow - 2y = 4 - 4$
$ \Rightarrow - 2y = 0$
$ \Rightarrow y = 0$
Now we draw a table for these values we have
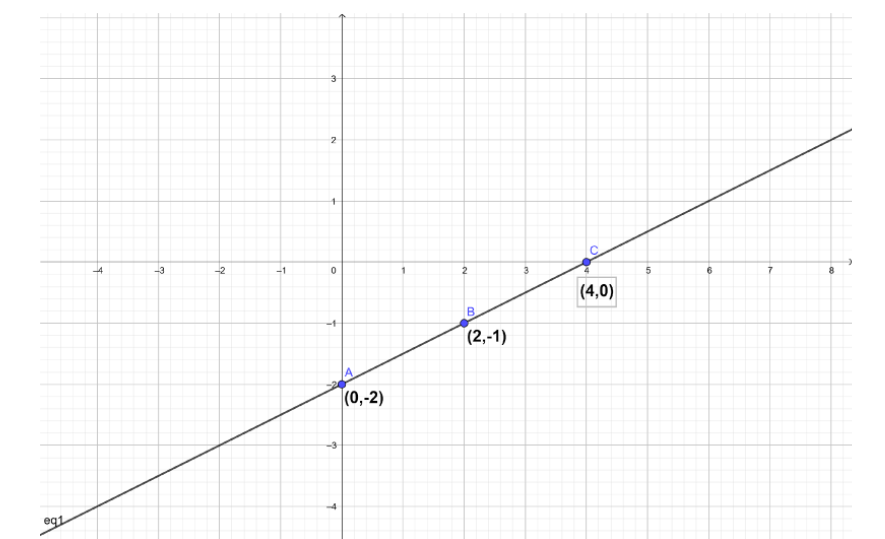
| x | $0$ | $2$ | $4$ |
| y | $ - 2$ | $ - 1$ | $0$ |
The graph plotted for these point is represented below:
Note: The graph has two axes: x-axis and y-axis. X-axis is the horizontal axis and the y-axis is the vertical axis. The slope of the line is denoted by ‘m’ and tells the rate of change of y with respect to x. y is the dependent variable and x is the independent variable. The graph that we have plotted has a scale of one unit square representing one unit.

Recently Updated Pages
Master Class 8 Social Science: Engaging Questions & Answers for Success
Master Class 8 English: Engaging Questions & Answers for Success
Class 8 Question and Answer - Your Ultimate Solutions Guide
Master Class 8 Maths: Engaging Questions & Answers for Success
Master Class 8 Science: Engaging Questions & Answers for Success
Master Class 9 General Knowledge: Engaging Questions & Answers for Success
Trending doubts
What is BLO What is the full form of BLO class 8 social science CBSE
Citizens of India can vote at the age of A 18 years class 8 social science CBSE
Full form of STD, ISD and PCO
Advantages and disadvantages of science
Right to vote is a AFundamental Right BFundamental class 8 social science CBSE
What are the 12 elements of nature class 8 chemistry CBSE