How do you graph the line \[x - y = 5\]?
Answer
543.6k+ views
Hint: in the above question we are given an equation that is \[x - y = 5\] and we are asked how to draw the graph of the equation. For which we would first check if the equation provided to us is in the simplest form or not. If not we would simplify that then we would proceed further to draw its graph by finding the points that satisfy the equation provided to us in the question for the graph. Let us see the whole process of plotting the graph of the given equation that is \[x - y = 5\] in detail in the complete step by step solution.
Complete step by step solution:
So here we are provided with an equation \[x - y = 5\] and we are asked how we would graph this equation.
Now for drawing the graph of any equation we need to check for the points satisfying the equation and which would help in the plotting of the graph. For the points we need to check first if the given equation is its simplest form or not if not we would make it into its simpler form.
So for the given equation that is \[x - y = 5\] the simplest form is provided to us with.
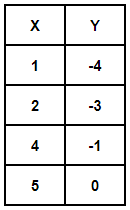
Now we would find the table of the points satisfying the given equation that is as follows –
Putting \[x = 1,2,4,5\] in the given equation \[x - y = 5\] we get \[y = - 4, - 3, - 1,0\]

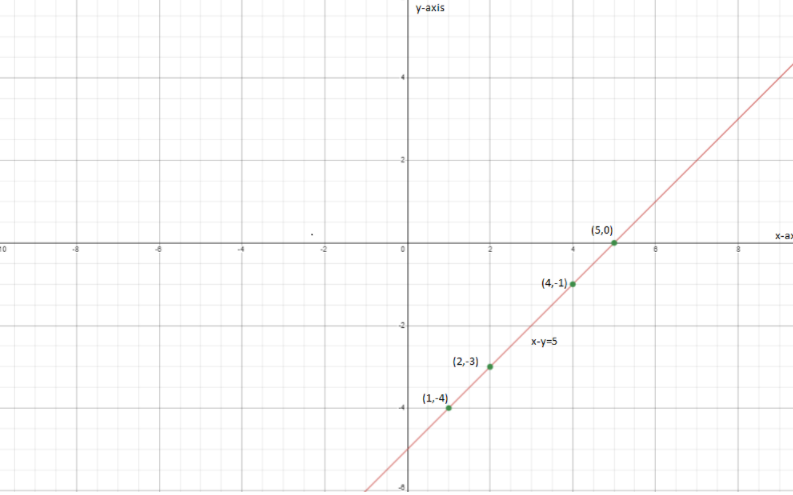
Now plotting the satisfying points of the equation on the graph the resultant graph is depicted below-

Note :
In these types of questions one should keep a deep eye on the equation on how to solve it to get its simplest form out easily and correctly. Luckily here the equation was already in its simplest form so no difficulty was there. Also, the concentration should be full while finding the points that satisfy the equation and the plotting of those points on the graph as a flaw that can make the answer wrong completely.
Complete step by step solution:
So here we are provided with an equation \[x - y = 5\] and we are asked how we would graph this equation.
Now for drawing the graph of any equation we need to check for the points satisfying the equation and which would help in the plotting of the graph. For the points we need to check first if the given equation is its simplest form or not if not we would make it into its simpler form.
So for the given equation that is \[x - y = 5\] the simplest form is provided to us with.
Now we would find the table of the points satisfying the given equation that is as follows –
Putting \[x = 1,2,4,5\] in the given equation \[x - y = 5\] we get \[y = - 4, - 3, - 1,0\]

Now plotting the satisfying points of the equation on the graph the resultant graph is depicted below-

Note :
In these types of questions one should keep a deep eye on the equation on how to solve it to get its simplest form out easily and correctly. Luckily here the equation was already in its simplest form so no difficulty was there. Also, the concentration should be full while finding the points that satisfy the equation and the plotting of those points on the graph as a flaw that can make the answer wrong completely.
Recently Updated Pages
Master Class 11 Computer Science: Engaging Questions & Answers for Success

Master Class 11 Business Studies: Engaging Questions & Answers for Success

Master Class 11 Economics: Engaging Questions & Answers for Success

Master Class 11 English: Engaging Questions & Answers for Success

Master Class 11 Maths: Engaging Questions & Answers for Success

Master Class 11 Biology: Engaging Questions & Answers for Success

Trending doubts
One Metric ton is equal to kg A 10000 B 1000 C 100 class 11 physics CBSE

There are 720 permutations of the digits 1 2 3 4 5 class 11 maths CBSE

Discuss the various forms of bacteria class 11 biology CBSE

Draw a diagram of a plant cell and label at least eight class 11 biology CBSE

State the laws of reflection of light

Explain zero factorial class 11 maths CBSE


