


How do you graph the line $-x-3y=2$ ?
Answer
557.7k+ views
Hint: We know that the equation of a straight line is y = mx + c and we can represent the equation of straight line in another form $ax+by=c$ , we can convert this into y = mx + c where m is the slope of line and c is the y intercept of the straight line.
Complete step by step answer:
The given equation of the line is $-x-3y=2$
We can draw the graph of the straight line by joining any 2 points which are on the line or satisfy the equation of line
So let’s choose any 2 points which are on the straight line $-x-3y=2$
Let’s take x equal to 0 so the value of y will be $-\dfrac{2}{3}$
So one point is $\left( 0,-\dfrac{2}{3} \right)$
For another point let’s take y equal to 0, so the value of x equal to – 2
So another point is $\left( -2,0 \right)$
So the graph of $-x-3y=2$ will joining the points $\left( 0,-\dfrac{2}{3} \right)$ and $\left( -2,0 \right)$ and extend the line infinitely
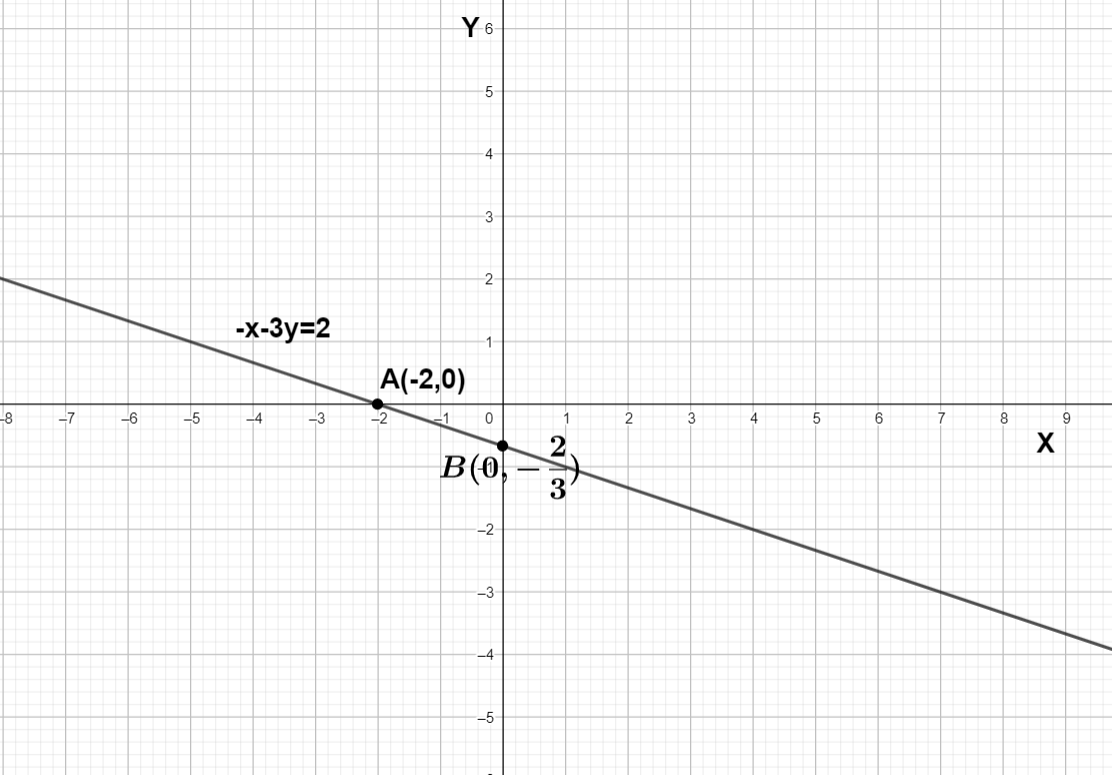
We can see the graph of $-x-3y=2$ is the straight line joining 2 points A $\left( -2,0 \right)$ and B $\left( 0,-\dfrac{2}{3} \right)$
Note:
We can write all the lines in the form y = mx+ c except all the lines which are parallel to the Y axis. The reason behind it is the slope of all the lines which are parallel to the Y axis tends to infinity. The equation of all such lines is x=k where k is a constant.
Complete step by step answer:
The given equation of the line is $-x-3y=2$
We can draw the graph of the straight line by joining any 2 points which are on the line or satisfy the equation of line
So let’s choose any 2 points which are on the straight line $-x-3y=2$
Let’s take x equal to 0 so the value of y will be $-\dfrac{2}{3}$
So one point is $\left( 0,-\dfrac{2}{3} \right)$
For another point let’s take y equal to 0, so the value of x equal to – 2
So another point is $\left( -2,0 \right)$
So the graph of $-x-3y=2$ will joining the points $\left( 0,-\dfrac{2}{3} \right)$ and $\left( -2,0 \right)$ and extend the line infinitely
We can see the graph of $-x-3y=2$ is the straight line joining 2 points A $\left( -2,0 \right)$ and B $\left( 0,-\dfrac{2}{3} \right)$
Note:
We can write all the lines in the form y = mx+ c except all the lines which are parallel to the Y axis. The reason behind it is the slope of all the lines which are parallel to the Y axis tends to infinity. The equation of all such lines is x=k where k is a constant.
Recently Updated Pages
Master Class 11 Computer Science: Engaging Questions & Answers for Success
Master Class 11 Business Studies: Engaging Questions & Answers for Success
Master Class 11 Economics: Engaging Questions & Answers for Success
Master Class 11 English: Engaging Questions & Answers for Success
Master Class 11 Maths: Engaging Questions & Answers for Success
Master Class 11 Biology: Engaging Questions & Answers for Success
Trending doubts
One Metric ton is equal to kg A 10000 B 1000 C 100 class 11 physics CBSE
There are 720 permutations of the digits 1 2 3 4 5 class 11 maths CBSE
Discuss the various forms of bacteria class 11 biology CBSE
Draw a diagram of a plant cell and label at least eight class 11 biology CBSE
State the laws of reflection of light
Explain zero factorial class 11 maths CBSE