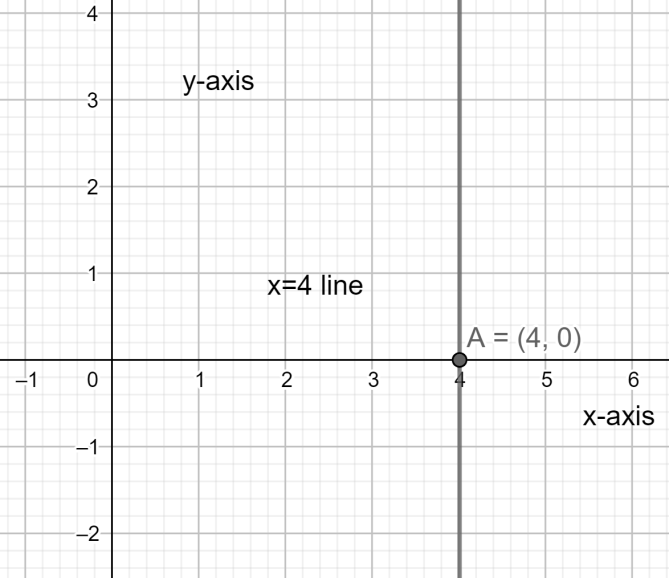
How do you graph the line $x=4$ ?
Answer
543k+ views
Hint: In this question we have been asked to draw the graph of the given line $x=4$ . By observing the given line equation we can say that it has a constant “x” value for varying “y” values. Hence the given line will be parallel to the y-axis and passing through the point 4 on the x-axis.
Complete step by step solution:
Now considering from the question we have been asked to draw the graph of the given line $x=4$ .
By observing the given line equation we can say that it has a constant “x” value for varying “y” values. Hence the given line will be parallel to the y-axis and passing through the point 4 on the x-axis.
Hence, the given line will pass through (4,0) point.
The required graph of the given line equation will appear similar to the below shown graph:

Therefore we can conclude that the required graph of the given line equation is located above.
Note: During the process of answering questions of this type we should be sure with our concepts that we are going to apply and carefully plot the required graph. This is a very simple and easy question and can be answered in a short span of time. Very few mistakes are possible in questions of this type. Similarly a line equation in which the “y” value is constant will be parallel to the x-axis. For example the line having equation y=a will pass through (0,a) and lie parallel to x-axis.
Complete step by step solution:
Now considering from the question we have been asked to draw the graph of the given line $x=4$ .
By observing the given line equation we can say that it has a constant “x” value for varying “y” values. Hence the given line will be parallel to the y-axis and passing through the point 4 on the x-axis.
Hence, the given line will pass through (4,0) point.
The required graph of the given line equation will appear similar to the below shown graph:

Therefore we can conclude that the required graph of the given line equation is located above.
Note: During the process of answering questions of this type we should be sure with our concepts that we are going to apply and carefully plot the required graph. This is a very simple and easy question and can be answered in a short span of time. Very few mistakes are possible in questions of this type. Similarly a line equation in which the “y” value is constant will be parallel to the x-axis. For example the line having equation y=a will pass through (0,a) and lie parallel to x-axis.
Recently Updated Pages
Master Class 10 Computer Science: Engaging Questions & Answers for Success

Master Class 10 General Knowledge: Engaging Questions & Answers for Success

Master Class 10 English: Engaging Questions & Answers for Success

Master Class 10 Social Science: Engaging Questions & Answers for Success

Master Class 10 Maths: Engaging Questions & Answers for Success

Master Class 10 Science: Engaging Questions & Answers for Success

Trending doubts
What is the median of the first 10 natural numbers class 10 maths CBSE

Which women's tennis player has 24 Grand Slam singles titles?

Who is the Brand Ambassador of Incredible India?

Why is there a time difference of about 5 hours between class 10 social science CBSE

Write a letter to the principal requesting him to grant class 10 english CBSE

State and prove converse of BPT Basic Proportionality class 10 maths CBSE


