


How do you graph $x=-3$ ?
Answer
563.1k+ views
Hint: $x=-3$ is a straight line where x is constant irrespective of y. The graph will be a straight line parallel to Y axis at a distance of 3 units from Y axis towards left. The slope of the straight line is infinity as it is parallel to the Y axis.
Complete step by step answer:
In $x=c$ the value of x is a constant that means it does not depend on the value of Y. So it will be a straight line parallel to Y axis at a distance $\left| c \right|$ units from the Y axis towards left or right depending whether c is positive or negative.
So the graph of $x=-3$ will be a straight line parallel to the Y axis at a distance of 3 units towards the left of the Y axis.
So let’s draw the graph of $x=-3$
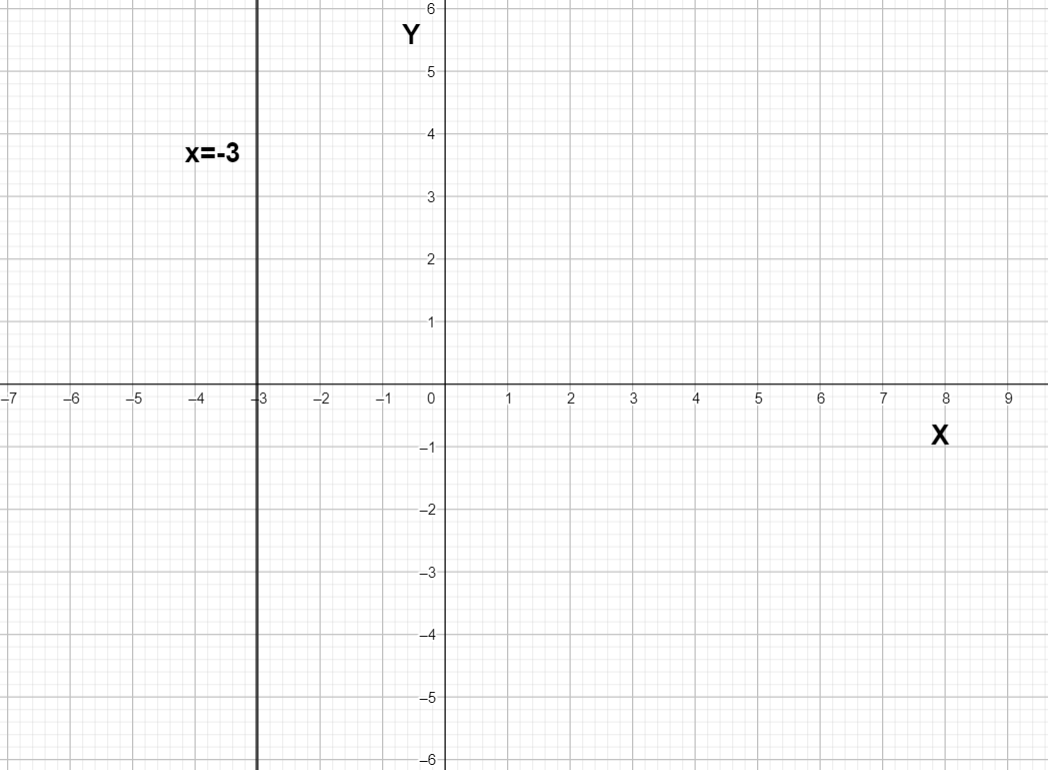
We can see that the graph is a straight line where the line is parallel to the Y axis .
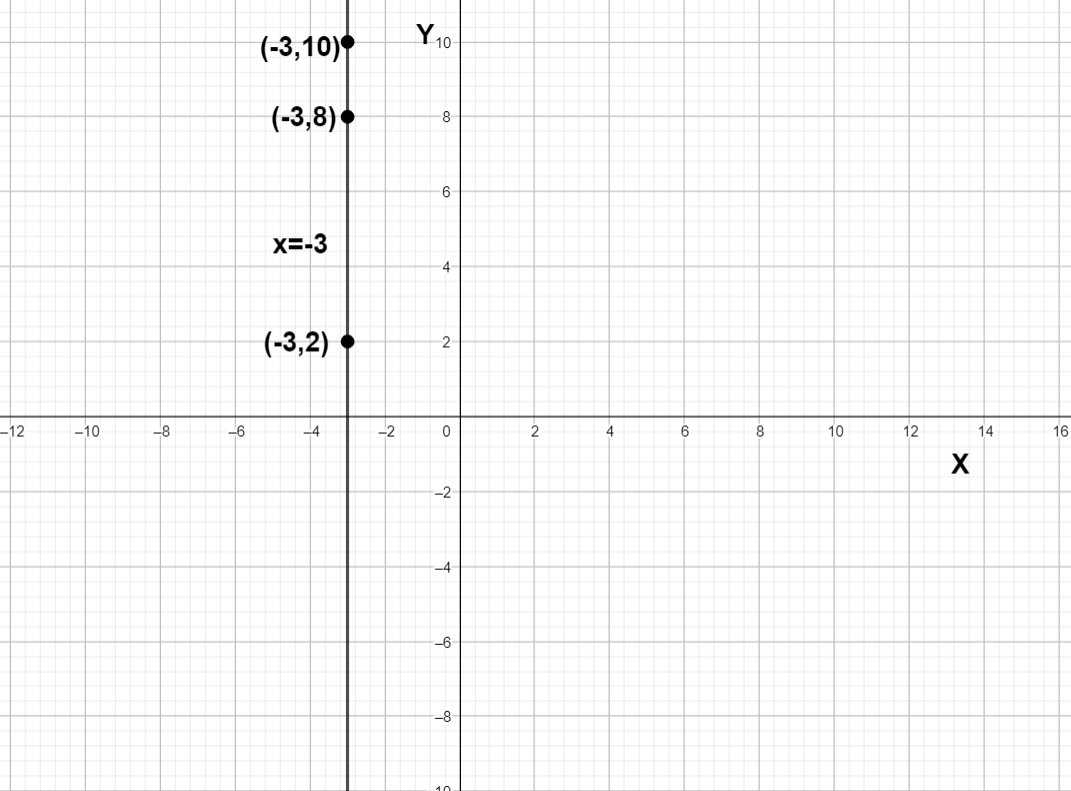
We can try another method. We can take several points of the function and join them to draw the graph. So let’s take points (-3,2) , (-3,8) , (-3,10) and join them to draw the graph.
Note: We know that the standard form of a straight line is $y=mx+c$ but when x is constant the value of m is tend to infinity so we can’t write the straight line in the form of $y=mx+c$ there is no c here because the straight line does not intersect Y axis so there is no Y intercept unless the equation is $x=0$ in that case there are infinite value of c.
Complete step by step answer:
In $x=c$ the value of x is a constant that means it does not depend on the value of Y. So it will be a straight line parallel to Y axis at a distance $\left| c \right|$ units from the Y axis towards left or right depending whether c is positive or negative.
So the graph of $x=-3$ will be a straight line parallel to the Y axis at a distance of 3 units towards the left of the Y axis.
So let’s draw the graph of $x=-3$
We can see that the graph is a straight line where the line is parallel to the Y axis .
We can try another method. We can take several points of the function and join them to draw the graph. So let’s take points (-3,2) , (-3,8) , (-3,10) and join them to draw the graph.
Note: We know that the standard form of a straight line is $y=mx+c$ but when x is constant the value of m is tend to infinity so we can’t write the straight line in the form of $y=mx+c$ there is no c here because the straight line does not intersect Y axis so there is no Y intercept unless the equation is $x=0$ in that case there are infinite value of c.
Recently Updated Pages
Master Class 12 Economics: Engaging Questions & Answers for Success
Master Class 12 Physics: Engaging Questions & Answers for Success
Master Class 12 English: Engaging Questions & Answers for Success
Master Class 12 Social Science: Engaging Questions & Answers for Success
Master Class 12 Maths: Engaging Questions & Answers for Success
Master Class 12 Business Studies: Engaging Questions & Answers for Success
Trending doubts
Which are the Top 10 Largest Countries of the World?
What are the major means of transport Explain each class 12 social science CBSE
Draw a labelled sketch of the human eye class 12 physics CBSE
Why cannot DNA pass through cell membranes class 12 biology CBSE
Differentiate between insitu conservation and exsitu class 12 biology CBSE
Draw a neat and well labeled diagram of TS of ovary class 12 biology CBSE