


How do you graph $y = 3\sin 2x$ ?
Answer
558k+ views
Hint: We are given a function of sine that we have to plot on the graph. For plotting any function on the graph, we first convert the given function to the standard form and then compare it with the standard equation, this way we can find out how the graph should be plotted. The standard form of the sine equation is $y = A\sin (Bx + C) + D$ .
Complete step by step solution:
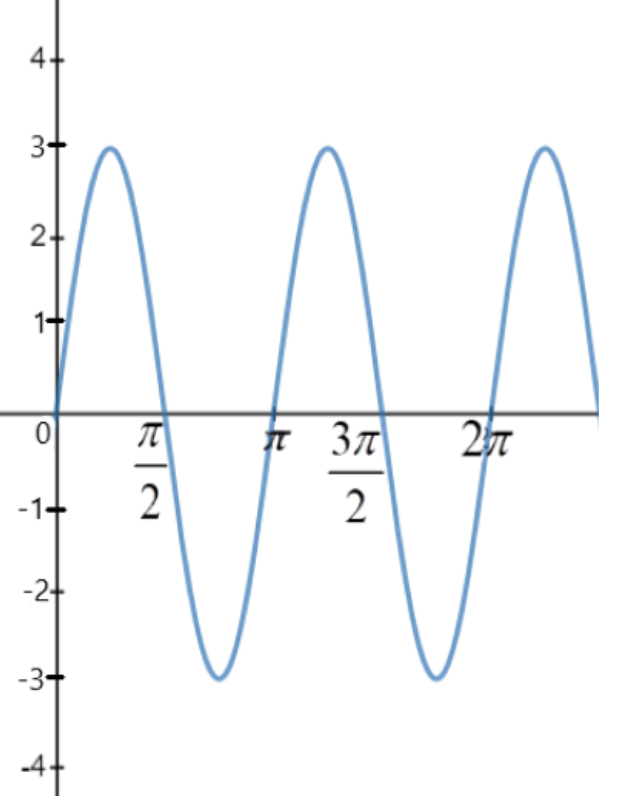
Comparing $y = 3\sin 2x$ with the standard form $y = A\sin (Bx + C) + D$ , we get –
$A = 3,\,B = 2,\,C = 0\,and\,D = 0$
Thus, the given sine function has peak values at 3 and -3, that is, it oscillates between 3 and -3 and the given sine function completes two oscillations between 0 and $2\pi $ , but for plotting the graph, we have to find out the period of the function. Period of a sine function is –
$
p = \dfrac{{2\pi }}{B} \\
\Rightarrow p = \dfrac{{2\pi }}{2} = \pi \\
$
That is the given function repeats the oscillation after every $\pi $ radians, it completes 1 oscillation in the interval 0 to $\pi $ .
Now, We know all the quantities for plotting the graph of the given function, so the graph of $y = 3\sin 2x$ is plotted as follows –
Note: We know that the general form of the sine function is $y = A\sin (Bx + C) + D$ where
- A is the amplitude, that is, A tells us the value of the peaks of the function.
- B is the frequency, that is, B tells us the number of oscillations a function does in a fixed interval.
- The horizontal and vertical shift of a function is denoted by C and D respectively. The value of C and D is zero for the given function, so there is no horizontal or vertical shift.
Complete step by step solution:
Comparing $y = 3\sin 2x$ with the standard form $y = A\sin (Bx + C) + D$ , we get –
$A = 3,\,B = 2,\,C = 0\,and\,D = 0$
Thus, the given sine function has peak values at 3 and -3, that is, it oscillates between 3 and -3 and the given sine function completes two oscillations between 0 and $2\pi $ , but for plotting the graph, we have to find out the period of the function. Period of a sine function is –
$
p = \dfrac{{2\pi }}{B} \\
\Rightarrow p = \dfrac{{2\pi }}{2} = \pi \\
$
That is the given function repeats the oscillation after every $\pi $ radians, it completes 1 oscillation in the interval 0 to $\pi $ .
Now, We know all the quantities for plotting the graph of the given function, so the graph of $y = 3\sin 2x$ is plotted as follows –
Note: We know that the general form of the sine function is $y = A\sin (Bx + C) + D$ where
- A is the amplitude, that is, A tells us the value of the peaks of the function.
- B is the frequency, that is, B tells us the number of oscillations a function does in a fixed interval.
- The horizontal and vertical shift of a function is denoted by C and D respectively. The value of C and D is zero for the given function, so there is no horizontal or vertical shift.
Recently Updated Pages
Master Class 12 Economics: Engaging Questions & Answers for Success
Master Class 12 Physics: Engaging Questions & Answers for Success
Master Class 12 English: Engaging Questions & Answers for Success
Master Class 12 Social Science: Engaging Questions & Answers for Success
Master Class 12 Maths: Engaging Questions & Answers for Success
Master Class 12 Business Studies: Engaging Questions & Answers for Success
Trending doubts
Which are the Top 10 Largest Countries of the World?
What are the major means of transport Explain each class 12 social science CBSE
Draw a labelled sketch of the human eye class 12 physics CBSE
Why cannot DNA pass through cell membranes class 12 biology CBSE
Differentiate between insitu conservation and exsitu class 12 biology CBSE
Draw a neat and well labeled diagram of TS of ovary class 12 biology CBSE