


How do you graph $y = 3x - 7?$
Answer
556.2k+ views
Hint: Whenever they ask us to draw a graph for a straight line equation we need to have a minimum of two points, it may be intercept points or any other point. We can get the points by substituting or assuming different values for $x$ and finding the corresponding values of $y$. By using these points we can plot the graph for the given equation.
Complete step by step answer:
The given equation $y = 3x - 7$ is a straight line equation, where we need to have a minimum of two points to plot a graph. The two points may be intercepts that are x-intercept and y-intercept which means x-intercept is a point that passes the x-axis at $y = 0$ and the y-intercept is a point that passes the y-axis at $x = 0$. We can also find the point by taking different values for $x$ and finding the corresponding values of $y$ by substituting them back in the equation.
Now, we find the y-intercept by putting $x = 0$ in the equation $y = 3x - 7$
Therefore we get, $y = 3 \times 0 - 7$
$ \Rightarrow y = - 7$ at $x = 0$
Now, we find the x-intercept by putting $y = 0$ in the equation $y = 3x - 7$
Therefore we get, $0 = 3x - 7$
$ \Rightarrow 3x = 7$
$ \Rightarrow x = \dfrac{7}{3} = 2.333$ at $y = 0$
For better understanding, we take some more points for $x$ and find the corresponding values of $y$.
Let us substitute $x = 1$ in the equation $y = 3x - 7$, we get
$y = 3 \times 1 - 7$
$ \Rightarrow y = 3 - 7 = - 4$
Now, substitute $x = 2$ in the equation $y = 3x - 7$, we get
$y = 3 \times 2 - 7$
$ \Rightarrow y = 6 - 7 = - 1$
Now, substitute $x = 3$ in the equation $y = 3x - 7$, we get
$y = 3 \times 3 - 7$
$ \Rightarrow y = 9 - 7 = 2$
So now we have points that are enough to draw a graph.
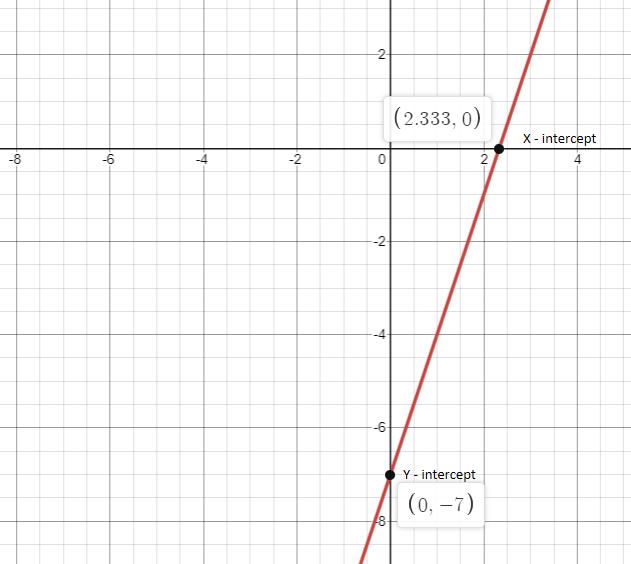
Plot the graph for the points, $(0, - 7)$ , $\left( {\dfrac{7}{3},0} \right)$ , $(1, - 4)$ , $(2, - 1)$ and $(3,2)$ .
The graph for the above points is as shown below:
Note:
Whenever they ask us to draw a graph by giving an equation, then just assume values for one unknown that is $x$ and find the corresponding values of another unknown that is $y$. Plot the same on a graph sheet. We require a minimum of two points to draw a graph but for your understanding try to take some more points and draw the graph as per the points.
Complete step by step answer:
The given equation $y = 3x - 7$ is a straight line equation, where we need to have a minimum of two points to plot a graph. The two points may be intercepts that are x-intercept and y-intercept which means x-intercept is a point that passes the x-axis at $y = 0$ and the y-intercept is a point that passes the y-axis at $x = 0$. We can also find the point by taking different values for $x$ and finding the corresponding values of $y$ by substituting them back in the equation.
Now, we find the y-intercept by putting $x = 0$ in the equation $y = 3x - 7$
Therefore we get, $y = 3 \times 0 - 7$
$ \Rightarrow y = - 7$ at $x = 0$
Now, we find the x-intercept by putting $y = 0$ in the equation $y = 3x - 7$
Therefore we get, $0 = 3x - 7$
$ \Rightarrow 3x = 7$
$ \Rightarrow x = \dfrac{7}{3} = 2.333$ at $y = 0$
For better understanding, we take some more points for $x$ and find the corresponding values of $y$.
Let us substitute $x = 1$ in the equation $y = 3x - 7$, we get
$y = 3 \times 1 - 7$
$ \Rightarrow y = 3 - 7 = - 4$
Now, substitute $x = 2$ in the equation $y = 3x - 7$, we get
$y = 3 \times 2 - 7$
$ \Rightarrow y = 6 - 7 = - 1$
Now, substitute $x = 3$ in the equation $y = 3x - 7$, we get
$y = 3 \times 3 - 7$
$ \Rightarrow y = 9 - 7 = 2$
So now we have points that are enough to draw a graph.
Plot the graph for the points, $(0, - 7)$ , $\left( {\dfrac{7}{3},0} \right)$ , $(1, - 4)$ , $(2, - 1)$ and $(3,2)$ .
The graph for the above points is as shown below:
Note:
Whenever they ask us to draw a graph by giving an equation, then just assume values for one unknown that is $x$ and find the corresponding values of another unknown that is $y$. Plot the same on a graph sheet. We require a minimum of two points to draw a graph but for your understanding try to take some more points and draw the graph as per the points.
Recently Updated Pages
Master Class 11 Computer Science: Engaging Questions & Answers for Success
Master Class 11 Business Studies: Engaging Questions & Answers for Success
Master Class 11 Economics: Engaging Questions & Answers for Success
Master Class 11 English: Engaging Questions & Answers for Success
Master Class 11 Maths: Engaging Questions & Answers for Success
Master Class 11 Biology: Engaging Questions & Answers for Success
Trending doubts
One Metric ton is equal to kg A 10000 B 1000 C 100 class 11 physics CBSE
There are 720 permutations of the digits 1 2 3 4 5 class 11 maths CBSE
Discuss the various forms of bacteria class 11 biology CBSE
Draw a diagram of a plant cell and label at least eight class 11 biology CBSE
State the laws of reflection of light
Explain zero factorial class 11 maths CBSE