


How do you graph \[y = {x^2} - 3\]?
Answer
537.9k+ views
Hint: In the given question, we have been given an equation which has to be graphed. For doing that, we set the y-coordinate to be zero. Then we find the value of the abscissa. From there, we find the value of the y-coordinate. Then we graph the points and draw the figure.
Complete step by step solution:
In the given question, we have to graph \[y = {x^2} - 3\].
First, let us find the value of \[x\].
Put \[y = 0\],
\[{x^2} - 3 = 0 \Rightarrow {x^2} = 3\]
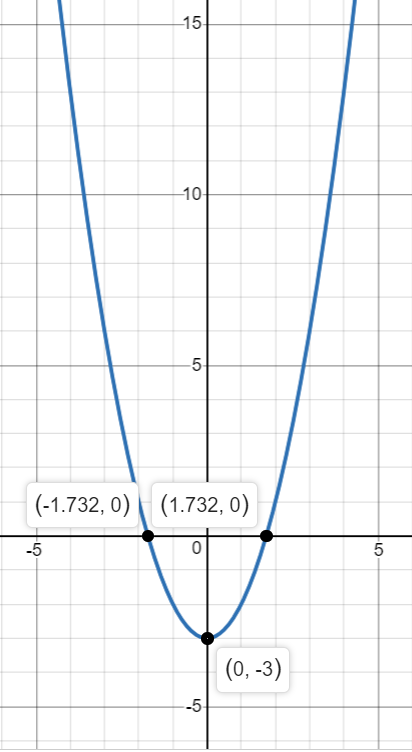
Thus, \[x = \pm \sqrt 3 \approx \pm 1.732\].
So, we have to x-intercepts – \[ - 1.732\] and \[1.732\].
Hence, we have two points – \[\left( { - 1.732,0} \right)\] and \[\left( {1.732,0} \right)\].
Now, we find the y-intercept.
Putting \[x = 0\],
\[y = - 3\]
Hence, we have the third point – \[\left( {0, - 3} \right)\].
Note: In the given question we had to graph a line whose equation was given. Here, the equation was not a linear equation. So, to do that, we found the value of the abscissas, then we obtained the value of y-coordinate and finally, we plot the points on a graph and draw the figure. So, it is important that we know the exact method of how to solve such questions, as following each step correctly is crucial to solve the question.
Complete step by step solution:
In the given question, we have to graph \[y = {x^2} - 3\].
First, let us find the value of \[x\].
Put \[y = 0\],
\[{x^2} - 3 = 0 \Rightarrow {x^2} = 3\]
Thus, \[x = \pm \sqrt 3 \approx \pm 1.732\].
So, we have to x-intercepts – \[ - 1.732\] and \[1.732\].
Hence, we have two points – \[\left( { - 1.732,0} \right)\] and \[\left( {1.732,0} \right)\].
Now, we find the y-intercept.
Putting \[x = 0\],
\[y = - 3\]
Hence, we have the third point – \[\left( {0, - 3} \right)\].
Note: In the given question we had to graph a line whose equation was given. Here, the equation was not a linear equation. So, to do that, we found the value of the abscissas, then we obtained the value of y-coordinate and finally, we plot the points on a graph and draw the figure. So, it is important that we know the exact method of how to solve such questions, as following each step correctly is crucial to solve the question.
Recently Updated Pages
Master Class 11 Computer Science: Engaging Questions & Answers for Success
Master Class 11 Business Studies: Engaging Questions & Answers for Success
Master Class 11 Economics: Engaging Questions & Answers for Success
Master Class 11 English: Engaging Questions & Answers for Success
Master Class 11 Maths: Engaging Questions & Answers for Success
Master Class 11 Biology: Engaging Questions & Answers for Success
Trending doubts
One Metric ton is equal to kg A 10000 B 1000 C 100 class 11 physics CBSE
There are 720 permutations of the digits 1 2 3 4 5 class 11 maths CBSE
Discuss the various forms of bacteria class 11 biology CBSE
Draw a diagram of a plant cell and label at least eight class 11 biology CBSE
State the laws of reflection of light
Explain zero factorial class 11 maths CBSE