


How do you graph $y=5-4x$?
Answer
553.8k+ views
Hint: The given equation $y=5-4x$ is linear with respect to both the variables $x$ and $y$. So it represents a straight line. Now, the equation is similar to the equation $y=x$. So by transforming the graph of the equation $y=x$, we can obtain the graph of the given equation $y=5-4x$. For this we first need to do the shifting of the graph of $y=x$ to obtain the graph of the equation $y=x+5$. Then we need to do the scaling of the graph of $y=x+5$ to obtain the graph of $y=4x+5$. Finally, on inverting the graph of $y=4x+5$ with respect to the y-axis, we will obtain the graph of $y=-4x+5$ or $y=5-4x$.
Complete step-by-step solution:
The equation to be graphed is given in the question as
$y=5-4x$
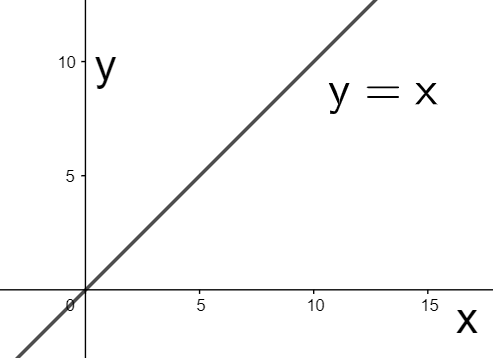
Since it is linear in $x$ and $y$, its graph is a straight line. Now, we can obtain its graph from the graph of the equation $y=x$ which is drawn as
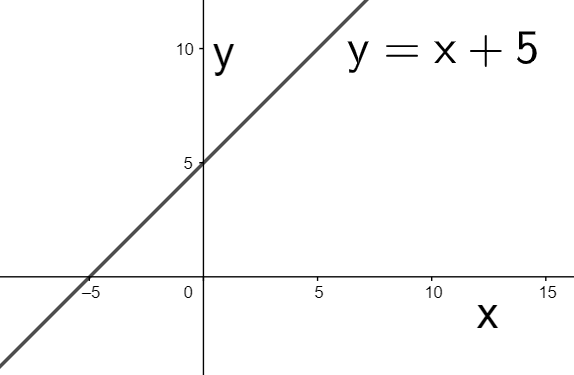
Now, let us change the independent variable $x$ in $y=x$ is changed to $x+5$ to obtain $y=x+5$. Since the variable $x$ is changed to $x+5$, so the above graph must be shifted by $5$ units in the negative x-direction to obtain the graph of $y=x+5$ as
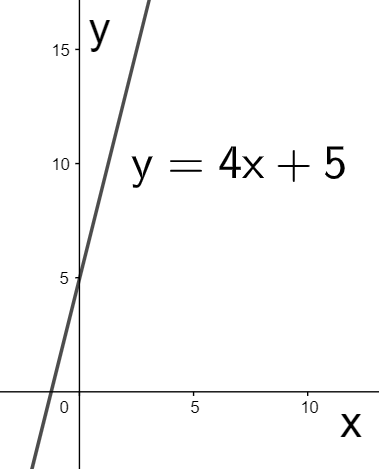
Now, we change the independent variable $x$ in $y=x+5$ to $4x$ to obtain $y=4x+5$. Since the variable $x$ is changed to $4x$, so the above graph must be contracted by $4$ units in the horizontal direction to get the graph of $y=4x+5$ as
Finally, to obtain the graph of $y=-4x+5$ from the previous graph of $y=4x+5$, we only need to change the variable $x$ to $-x$ so that the above graph must be inverted with respect to the y-axis to finally obtain the graph of $y=-4x+5$ or $y=5-4x$ as
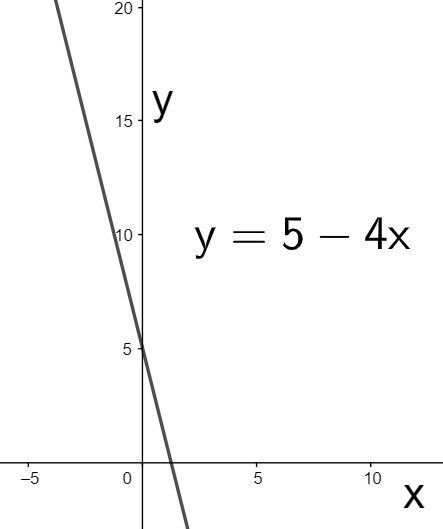
Hence, we have graphed $y=5-4x$.
Note: We must note that while transforming one graph to obtain the other, the change is reflected in the direction of the variable changed. The method of transformation of graphs is used for obtaining the graphs of many complex equations from the basic equations. However, the simple graph of a straight line can easily be plotted by finding the coordinates of any two points satisfying the given equation of line and joining them together to get the final plot.
Complete step-by-step solution:
The equation to be graphed is given in the question as
$y=5-4x$
Since it is linear in $x$ and $y$, its graph is a straight line. Now, we can obtain its graph from the graph of the equation $y=x$ which is drawn as
Now, let us change the independent variable $x$ in $y=x$ is changed to $x+5$ to obtain $y=x+5$. Since the variable $x$ is changed to $x+5$, so the above graph must be shifted by $5$ units in the negative x-direction to obtain the graph of $y=x+5$ as
Now, we change the independent variable $x$ in $y=x+5$ to $4x$ to obtain $y=4x+5$. Since the variable $x$ is changed to $4x$, so the above graph must be contracted by $4$ units in the horizontal direction to get the graph of $y=4x+5$ as
Finally, to obtain the graph of $y=-4x+5$ from the previous graph of $y=4x+5$, we only need to change the variable $x$ to $-x$ so that the above graph must be inverted with respect to the y-axis to finally obtain the graph of $y=-4x+5$ or $y=5-4x$ as
Hence, we have graphed $y=5-4x$.
Note: We must note that while transforming one graph to obtain the other, the change is reflected in the direction of the variable changed. The method of transformation of graphs is used for obtaining the graphs of many complex equations from the basic equations. However, the simple graph of a straight line can easily be plotted by finding the coordinates of any two points satisfying the given equation of line and joining them together to get the final plot.
Recently Updated Pages
Master Class 11 Computer Science: Engaging Questions & Answers for Success
Master Class 11 Business Studies: Engaging Questions & Answers for Success
Master Class 11 Economics: Engaging Questions & Answers for Success
Master Class 11 English: Engaging Questions & Answers for Success
Master Class 11 Maths: Engaging Questions & Answers for Success
Master Class 11 Biology: Engaging Questions & Answers for Success
Trending doubts
One Metric ton is equal to kg A 10000 B 1000 C 100 class 11 physics CBSE
There are 720 permutations of the digits 1 2 3 4 5 class 11 maths CBSE
Discuss the various forms of bacteria class 11 biology CBSE
Draw a diagram of a plant cell and label at least eight class 11 biology CBSE
State the laws of reflection of light
Explain zero factorial class 11 maths CBSE