


How will you graph\[f(x) = {7^x}\]?
Answer
545.4k+ views
Hint:
While solving this equation and to sketch a graph we need to find enough points by using table function or by substituting the value of \[x\] in the equation and finding the value of\[y\]. After grabbing enough points we will join the point and draw a smooth curve and we are aware that exponential functions have horizontal asymptote which is basically a line on a graph that is approached by a curve but never reached. Remember that \[y = 0\] is the equation of horizontal asymptote.
Complete step by step solution:
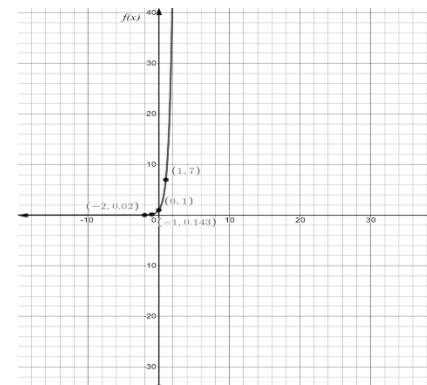
Here we will put different values of \[x\] and to find the value of \[y\] we will put the value of \[x\] in the equation. So we will basically graph using table of values like if we put \[x = 1\] in the equation then we will get \[y = 7\]
\[
\Rightarrow x = - 2,y = \dfrac{1}{{49}} \\
\Rightarrow x = - 1,y = \dfrac{1}{7} \\
\Rightarrow x = 0,y = 1 \\
\Rightarrow x = 1,y = 7 \\
\Rightarrow x = 2,y = 49 \\
\]
Later on we will plot the points and sketch a curve through the point after finding all the points. We will observe a proper smooth shape of the curve by connecting the points. So the graph obtained for the above equation is as followed.
Formula:
By using a table of function we will set the value of \[x\] and substitute in the equation finding value of \[y\]. Then after finding enough points we will sketch a graph.
Additional information:
Keep in mind that a horizontal asymptote is technically limited (\[x = \infty \] or \[x = - \infty \]) and due to this end behavior of function is measured by it. The graph of the function includes all the values of \[x\] and the corresponding values of \[y\] that are possible and due to this the graph is a line and not just the dots.
Note:
In the above problem we found that the graph is increasing and here we need to determine the points on the line then we need to plot the points and later on a sketch is curved throughout the point. Keep in mind of not connecting the dots. Exponential functions have horizontal asymptote and the equation of this horizontal asymptote is \[y = 0\]. Keep in mind that while graphing a function the most significant and helpful step is to make a table of values and inclusion of negative value, positive value and zero for ensuring that we have a linear function is a good idea.
While solving this equation and to sketch a graph we need to find enough points by using table function or by substituting the value of \[x\] in the equation and finding the value of\[y\]. After grabbing enough points we will join the point and draw a smooth curve and we are aware that exponential functions have horizontal asymptote which is basically a line on a graph that is approached by a curve but never reached. Remember that \[y = 0\] is the equation of horizontal asymptote.
Complete step by step solution:
Here we will put different values of \[x\] and to find the value of \[y\] we will put the value of \[x\] in the equation. So we will basically graph using table of values like if we put \[x = 1\] in the equation then we will get \[y = 7\]
\[
\Rightarrow x = - 2,y = \dfrac{1}{{49}} \\
\Rightarrow x = - 1,y = \dfrac{1}{7} \\
\Rightarrow x = 0,y = 1 \\
\Rightarrow x = 1,y = 7 \\
\Rightarrow x = 2,y = 49 \\
\]
Later on we will plot the points and sketch a curve through the point after finding all the points. We will observe a proper smooth shape of the curve by connecting the points. So the graph obtained for the above equation is as followed.
Formula:
By using a table of function we will set the value of \[x\] and substitute in the equation finding value of \[y\]. Then after finding enough points we will sketch a graph.
Additional information:
Keep in mind that a horizontal asymptote is technically limited (\[x = \infty \] or \[x = - \infty \]) and due to this end behavior of function is measured by it. The graph of the function includes all the values of \[x\] and the corresponding values of \[y\] that are possible and due to this the graph is a line and not just the dots.
Note:
In the above problem we found that the graph is increasing and here we need to determine the points on the line then we need to plot the points and later on a sketch is curved throughout the point. Keep in mind of not connecting the dots. Exponential functions have horizontal asymptote and the equation of this horizontal asymptote is \[y = 0\]. Keep in mind that while graphing a function the most significant and helpful step is to make a table of values and inclusion of negative value, positive value and zero for ensuring that we have a linear function is a good idea.
Recently Updated Pages
Master Class 11 Computer Science: Engaging Questions & Answers for Success
Master Class 11 Business Studies: Engaging Questions & Answers for Success
Master Class 11 Economics: Engaging Questions & Answers for Success
Master Class 11 English: Engaging Questions & Answers for Success
Master Class 11 Maths: Engaging Questions & Answers for Success
Master Class 11 Biology: Engaging Questions & Answers for Success
Trending doubts
One Metric ton is equal to kg A 10000 B 1000 C 100 class 11 physics CBSE
There are 720 permutations of the digits 1 2 3 4 5 class 11 maths CBSE
Discuss the various forms of bacteria class 11 biology CBSE
Draw a diagram of a plant cell and label at least eight class 11 biology CBSE
State the laws of reflection of light
Explain zero factorial class 11 maths CBSE