


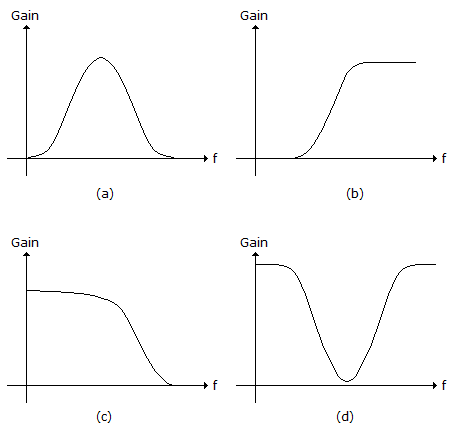
Identify the frequency response curve for a band pass filter.
(A) a
(B) b
(C) c
(D) d
Answer
564.3k+ views
Hint: The band pass filters are commonly used to filter a certain frequency range or band of frequencies. Thus, from the graph which only allows the certain frequency range will be the band pass filter.
Complete solution:
The band pass filters are designed by connecting the low pass filter and high pass filter. The low pass filters will only allow signals of low frequency. Where, the high pass filter will allow the signals of high frequency. Thus, the band pass will pass a certain frequency range between the low frequency and high frequency. This is how they are called as band pass filters.
The graph shown here represents the filters.
The graph b shows the low pass filter since the gain is only for low frequencies. The graph c shows the high pass filter since the high frequencies have gain. Since the band pass filter is the combination of low pass filter and high pass filter, the graph a can be such a combination. The graph d is the inverse of the graph a, so the graph a is the frequency response curve for a band pass filter. It is clear from the graph that the certain frequency range only has gain. Thus, forms a band of frequencies. And the gain attains a peak value at a particular frequency. And the band width will be the difference between the lower cut off frequency and higher cut off frequency.
The answer is option A.
Note: The gain of the band pass filter will be maximum at a certain frequency. The signals below the lower cut off frequency and above the higher cut of frequency are attenuated. And the band width will be the difference between the lower cut off frequency and higher cut off frequency.
Recently Updated Pages
Master Class 12 Economics: Engaging Questions & Answers for Success
Master Class 12 Physics: Engaging Questions & Answers for Success
Master Class 12 English: Engaging Questions & Answers for Success
Master Class 12 Social Science: Engaging Questions & Answers for Success
Master Class 12 Maths: Engaging Questions & Answers for Success
Master Class 12 Business Studies: Engaging Questions & Answers for Success
Trending doubts
Which are the Top 10 Largest Countries of the World?
What are the major means of transport Explain each class 12 social science CBSE
Draw a labelled sketch of the human eye class 12 physics CBSE
Why cannot DNA pass through cell membranes class 12 biology CBSE
Differentiate between insitu conservation and exsitu class 12 biology CBSE
Draw a neat and well labeled diagram of TS of ovary class 12 biology CBSE