


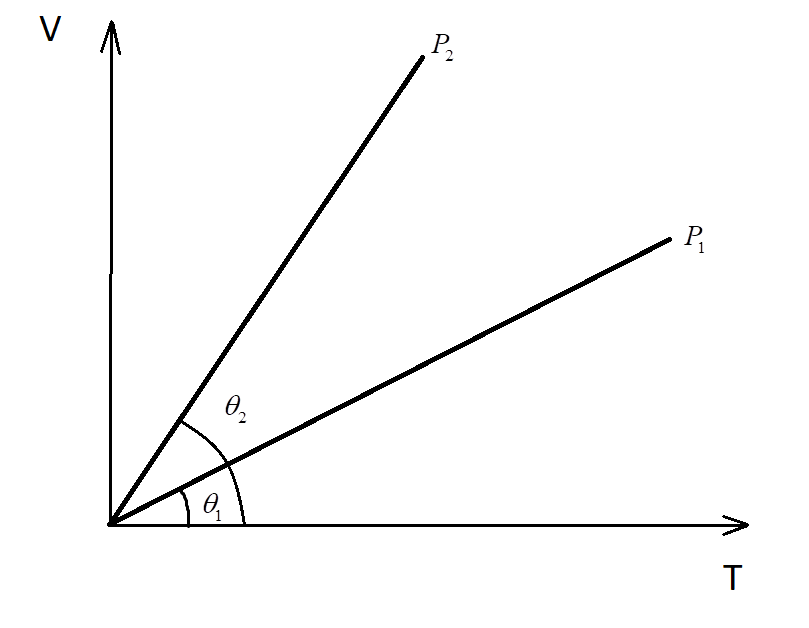
In the given (V-T) diagram, what is the relation between pressures ${P_1}$ and ${P_2}$?

Answer
544.2k+ views
Hint: The linear curve is passing through origin in volume (V) versus temperature (T) suggests that the given thermodynamic process is isobaric. In the isobaric process, the pressure of the thermodynamic system remains constant. To get the required relationship between the pressures for the given curves we will compare the slope of each curve and use the relation: slope $ = \left( {\dfrac{{nR}}{P}} \right)$, where n is the number of moles, R is the universal gas constant and P is the pressure.
Complete answer:
Consider the volume-temperature graph with two lines at different pressures ${P_1}$ and ${P_2}$.
Step I: Establish the relation between volume
An isobaric process is a constant pressure process. i.e., in an isobaric process, we have
$P = $Constant…………. (i)
By using ideal gas law:
$PV = nRT$
$ \Rightarrow \dfrac{V}{T} = \dfrac{{nR}}{P}$………………….. (ii)
Using equation (i) in (ii), we get
$ \Rightarrow \dfrac{V}{T} = $Constant
$ \Rightarrow V = CT$…………………… (iii), where C is a constant which is equal to $\left( {\dfrac{{nR}}{P}} \right)$.
∴ $V \propto T$
From equation (ii) we can say that the V-T graph is a straight line passing through the origin.
Step II: Calculate the slope of the isobaric curve.
From equation (ii)
$V = \dfrac{{nRT}}{P}$……. (iv)
Differentiating equation (iv) with respect to T.
$\dfrac{{dV}}{{dT}} = \dfrac{{nR}}{P} = $Slope
i.e., Slope$ \propto \dfrac{1}{P}$
So, if the slope of the curve increases then the pressure will decrease and vice versa.
Since from the given V-T graph:
${\theta _2} > {\theta _1}$
$ \Rightarrow $The slope of curve 2 > Slope of curve 1
$ \Rightarrow {P_2} < {P_1}$
Hence, the pressure of the second is lesser than the pressure in the first curve.
Note:
Students should note that in the isobaric process the pressure will remain constant and the V-T graph for the process is a straight line passing through the origin. While in the case of the P-V graph it will be horizontal and parallel to the volume axis.
Recently Updated Pages
Master Class 11 Computer Science: Engaging Questions & Answers for Success
Master Class 11 Business Studies: Engaging Questions & Answers for Success
Master Class 11 Economics: Engaging Questions & Answers for Success
Master Class 11 English: Engaging Questions & Answers for Success
Master Class 11 Maths: Engaging Questions & Answers for Success
Master Class 11 Biology: Engaging Questions & Answers for Success
Trending doubts
One Metric ton is equal to kg A 10000 B 1000 C 100 class 11 physics CBSE
There are 720 permutations of the digits 1 2 3 4 5 class 11 maths CBSE
Discuss the various forms of bacteria class 11 biology CBSE
Draw a diagram of a plant cell and label at least eight class 11 biology CBSE
State the laws of reflection of light
Explain zero factorial class 11 maths CBSE