


Name the physical quantity obtained by the slope of the displacement time graph.
Answer
568.8k+ views
Hint: A graph 2D graph having two axes, x-axis and y-axis is used to show the relation between two quantities which are represented on these axes.
Graphical method geometrical interpretation to show the relation between two quantities
This relation between the quantities is depicted by the slope of their graph.
Complete solution:
The x-axis on the graph is called abscissa and the y-axis is called the ordinate
But for easy understanding, we will refer to them as the x-axis and y-axis only
Here, we need to draw the diagram and assign quantities to the respective axis
We have got two quantities of displacement and time so we are assigning to the Y-axis and the time on the x-axis,
Have a look at the following image,
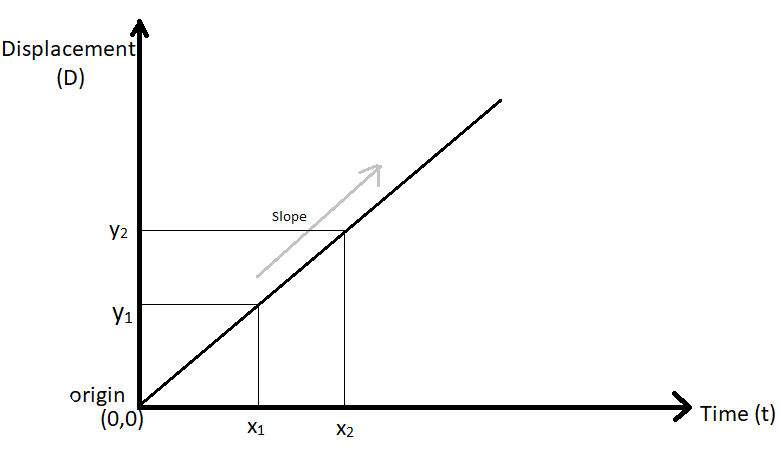
Here we can see that at the origin which is at (0,0) both the quantities have zero value now as we can see that as the value of displacement is increasing on the y axis the value of time is also increasing on the x-axis at t displacement $\left( D \right)$ =${y_1}$ the value of time is $\left( t \right) = {x_1}$.
So we can say that to have a displacement till ${y_1}$, ${x_1}$amount of time is used.
Or in other words, we can say that this graph tells us that how much displacement is covered in how much time so it is clear that it is showing us the relation between displacement and time.
The relation is the displacement of the object and the time taken for that displacement.
The relation shown by the graph is depicted in its slope so the slope here shows the rate of change of displacement with time.
So slope will be $\dfrac{{\Delta D}}{{\Delta t}}$
Now as we know the change in displacement to time is called velocity
$v = \dfrac{{\Delta D}}{{\Delta t}}$
So it is pretty much clear from the above equation that the slope of this graph shows us the relation between displacement and time which is called velocity.
Final answer is, The slope of the displacement time graph gives us the physical quantity called velocity.
Note: The straight line in the graph is showing that the relation between the two quantities is linear. Had it been a quadratic equation the nature of the graph would be parabolic.
The graph is the pictorial description of how one quantity is dependent on the other or we can say what effect one quantity has when another quantity changes.
The slope of the velocity-time graph gives acceleration and the slope under the acceleration time graph gives jerk.
Graphical method geometrical interpretation to show the relation between two quantities
This relation between the quantities is depicted by the slope of their graph.
Complete solution:
The x-axis on the graph is called abscissa and the y-axis is called the ordinate
But for easy understanding, we will refer to them as the x-axis and y-axis only
Here, we need to draw the diagram and assign quantities to the respective axis
We have got two quantities of displacement and time so we are assigning to the Y-axis and the time on the x-axis,
Have a look at the following image,
Here we can see that at the origin which is at (0,0) both the quantities have zero value now as we can see that as the value of displacement is increasing on the y axis the value of time is also increasing on the x-axis at t displacement $\left( D \right)$ =${y_1}$ the value of time is $\left( t \right) = {x_1}$.
So we can say that to have a displacement till ${y_1}$, ${x_1}$amount of time is used.
Or in other words, we can say that this graph tells us that how much displacement is covered in how much time so it is clear that it is showing us the relation between displacement and time.
The relation is the displacement of the object and the time taken for that displacement.
The relation shown by the graph is depicted in its slope so the slope here shows the rate of change of displacement with time.
So slope will be $\dfrac{{\Delta D}}{{\Delta t}}$
Now as we know the change in displacement to time is called velocity
$v = \dfrac{{\Delta D}}{{\Delta t}}$
So it is pretty much clear from the above equation that the slope of this graph shows us the relation between displacement and time which is called velocity.
Final answer is, The slope of the displacement time graph gives us the physical quantity called velocity.
Note: The straight line in the graph is showing that the relation between the two quantities is linear. Had it been a quadratic equation the nature of the graph would be parabolic.
The graph is the pictorial description of how one quantity is dependent on the other or we can say what effect one quantity has when another quantity changes.
The slope of the velocity-time graph gives acceleration and the slope under the acceleration time graph gives jerk.
Recently Updated Pages
Master Class 11 Computer Science: Engaging Questions & Answers for Success
Master Class 11 Business Studies: Engaging Questions & Answers for Success
Master Class 11 Economics: Engaging Questions & Answers for Success
Master Class 11 English: Engaging Questions & Answers for Success
Master Class 11 Maths: Engaging Questions & Answers for Success
Master Class 11 Biology: Engaging Questions & Answers for Success
Trending doubts
One Metric ton is equal to kg A 10000 B 1000 C 100 class 11 physics CBSE
There are 720 permutations of the digits 1 2 3 4 5 class 11 maths CBSE
Discuss the various forms of bacteria class 11 biology CBSE
Draw a diagram of a plant cell and label at least eight class 11 biology CBSE
State the laws of reflection of light
Explain zero factorial class 11 maths CBSE