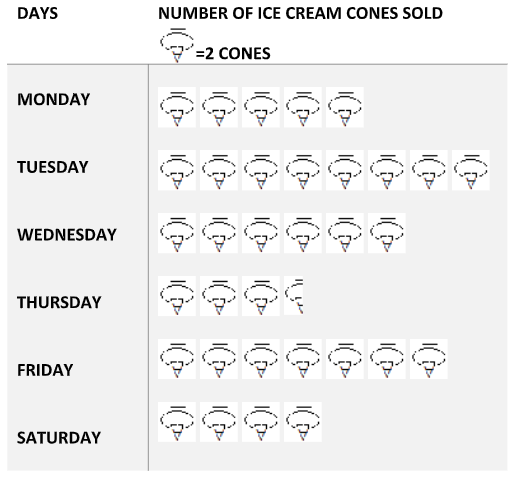
Observe the following pictograph which shows the number of ice cream cones sold by the school canteen during a week. Choose the correct answer from the given options:
Total number of ice cream cones sold during the whole week was:

(A) 33
(B) 67
(C) 63
(D) 57

Answer
516.9k+ views
Hint: We are given a pictograph showing the ice cream sold in a week in the question and we are asked to find the total number of ice cones sold in the specified week.
We are that each

corresponds to 2 ice cream cones.
In order to find the number of ice cream cones, we will find the daily sale of the ice cream cones by adding the

and then multiplying it with 2. We will add up each day’s sale and find the total number of cones sold on the given week. Hence, we will have the required number of ice cream cones sold.
Complete step by step answer:
According to the given question, we are given a pictograph depicting the ice cream cone sale in a week. We are asked in the question to find the number of ice cream cones sold in the week.
We are given that the figure

represents 2 cones.
If the complete figure means 2 cones then, the half of the figure, that is,

represents 1 cone.
In order to find the total number of ice cream cones sold, we will add up each day’s sale and then at the end add them together to get the total number of cones sold.
To find the daily sale of the ice cream cones, we will add up the number of the figure

and then multiply it with 2.
For Monday,
The number of cones sold = \[5\times 2=10cones\]
On Tuesday,
The number of cone sold = \[8\times 2=16cones\]
On Wednesday,
The number of cones sold = \[6\times 2=12cones\]
On Thursday, we have a half figure

which represents one cone.
The number of cones sold = \[\left( 3\times 2 \right)+1=7cones\]
On Friday,
The number of cones sold = \[7\times 2=14cones\]
And on Saturday, we have,
The number of cones sold = \[4\times 2=8cones\]
So, the total number of ice cream cones sold = \[10+16+12+7+14+8\]
\[\Rightarrow 67cones\]
So, the correct answer is “Option B”.
Note: The figures should be understood well and the difference between the complete diagram and half diagrams should be clearly understandable and that its meaning should be concluded correctly as well. Also, instead of adding the total number of cones of each day together, it should be done step wise to prevent mistakes, otherwise it might get a little complicated.
We are that each

corresponds to 2 ice cream cones.
In order to find the number of ice cream cones, we will find the daily sale of the ice cream cones by adding the

and then multiplying it with 2. We will add up each day’s sale and find the total number of cones sold on the given week. Hence, we will have the required number of ice cream cones sold.
Complete step by step answer:
According to the given question, we are given a pictograph depicting the ice cream cone sale in a week. We are asked in the question to find the number of ice cream cones sold in the week.
We are given that the figure

represents 2 cones.
If the complete figure means 2 cones then, the half of the figure, that is,

represents 1 cone.
In order to find the total number of ice cream cones sold, we will add up each day’s sale and then at the end add them together to get the total number of cones sold.
To find the daily sale of the ice cream cones, we will add up the number of the figure

and then multiply it with 2.
For Monday,
The number of cones sold = \[5\times 2=10cones\]
On Tuesday,
The number of cone sold = \[8\times 2=16cones\]
On Wednesday,
The number of cones sold = \[6\times 2=12cones\]
On Thursday, we have a half figure

which represents one cone.
The number of cones sold = \[\left( 3\times 2 \right)+1=7cones\]
On Friday,
The number of cones sold = \[7\times 2=14cones\]
And on Saturday, we have,
The number of cones sold = \[4\times 2=8cones\]
So, the total number of ice cream cones sold = \[10+16+12+7+14+8\]
\[\Rightarrow 67cones\]
So, the correct answer is “Option B”.
Note: The figures should be understood well and the difference between the complete diagram and half diagrams should be clearly understandable and that its meaning should be concluded correctly as well. Also, instead of adding the total number of cones of each day together, it should be done step wise to prevent mistakes, otherwise it might get a little complicated.
Recently Updated Pages
Master Class 9 General Knowledge: Engaging Questions & Answers for Success

Master Class 9 Social Science: Engaging Questions & Answers for Success

Master Class 9 English: Engaging Questions & Answers for Success

Master Class 9 Maths: Engaging Questions & Answers for Success

Master Class 9 Science: Engaging Questions & Answers for Success

Class 9 Question and Answer - Your Ultimate Solutions Guide

Trending doubts
Difference Between Plant Cell and Animal Cell

Fill the blanks with the suitable prepositions 1 The class 9 english CBSE

Who is eligible for RTE class 9 social science CBSE

Which places in India experience sunrise first and class 9 social science CBSE

What is pollution? How many types of pollution? Define it

Name 10 Living and Non living things class 9 biology CBSE


