


How will you plot the graph for the equation \[y = \sec x\] ?
Answer
562.5k+ views
Hint: In this equation, we have to draw/ plot the graph for the equation\[y = \sec x\]. We know that \[\sec x\]is the reciprocal of \[\cos x\]. So, the graph can be drawn easily if we know the graph of \[\cos x\].We need to find reciprocal of each \[y\] value that we have obtained for \[\cos x\] .
Complete step-by-step answer:
We will draw a table including different values for\[y = \cos x\], and then we will find it’s reciprocal \[\left( {\dfrac{1}{y}} \right)\] for the value of\[y = \sec x\].
We have included a value just smaller than \[\dfrac{\pi }{2} = 1.57\] so that we will get an idea what goes on there.
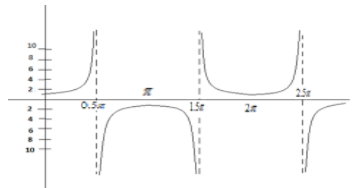
After applying the concept of reciprocal throughout the range of \[x\]values, we will proceed to plot the graph of \[y = \sec x\] . The graph of \[y = \sec x = \dfrac{1}{{\cos x}}\] for \[0 \leqslant x < \dfrac{{5\pi }}{2}\].
Additional information:
If we compare the graph of cosine and secant we can say that if the graph of cosine function decreases then the graph of secant function increases, similarly if the graph of cosine function increases the graph of secant function decreases. And if the cosine function is zero then the secant function will be undefined. From this we can also conclude that, because cosine is an even function, secant will also be an even function.
Note: Students should draw a proper and neat graph in accordance with the values of \[\sec x\].The secant is defined as a reciprocal of cosine. The secant function is undefined when the cosine is 0. We know that the cosine will be more than 1 in absolute value. Therefore the secant function will never be less than 1 in absolute value
Complete step-by-step answer:
We will draw a table including different values for\[y = \cos x\], and then we will find it’s reciprocal \[\left( {\dfrac{1}{y}} \right)\] for the value of\[y = \sec x\].
| \[x\] | \[y = \cos x\] | \[\dfrac{1}{y} = \sec x\] |
| \[0\] | \[1\] | \[1\] |
| \[1\] | \[0.54\] | \[1.85\] |
| \[1.55\] | \[0.02\] | \[48.09\] |
| \[2\] | \[ - 0.42\] | \[ - 2.4\] |
| \[3\] | \[ - 0.99\] | \[ - 1.01\] |
| \[4\] | \[ - 0.65\] | \[ - 1.53\] |
We have included a value just smaller than \[\dfrac{\pi }{2} = 1.57\] so that we will get an idea what goes on there.
After applying the concept of reciprocal throughout the range of \[x\]values, we will proceed to plot the graph of \[y = \sec x\] . The graph of \[y = \sec x = \dfrac{1}{{\cos x}}\] for \[0 \leqslant x < \dfrac{{5\pi }}{2}\].
Additional information:
If we compare the graph of cosine and secant we can say that if the graph of cosine function decreases then the graph of secant function increases, similarly if the graph of cosine function increases the graph of secant function decreases. And if the cosine function is zero then the secant function will be undefined. From this we can also conclude that, because cosine is an even function, secant will also be an even function.
Note: Students should draw a proper and neat graph in accordance with the values of \[\sec x\].The secant is defined as a reciprocal of cosine. The secant function is undefined when the cosine is 0. We know that the cosine will be more than 1 in absolute value. Therefore the secant function will never be less than 1 in absolute value
Recently Updated Pages
Master Class 11 Computer Science: Engaging Questions & Answers for Success
Master Class 11 Business Studies: Engaging Questions & Answers for Success
Master Class 11 Economics: Engaging Questions & Answers for Success
Master Class 11 English: Engaging Questions & Answers for Success
Master Class 11 Maths: Engaging Questions & Answers for Success
Master Class 11 Biology: Engaging Questions & Answers for Success
Trending doubts
One Metric ton is equal to kg A 10000 B 1000 C 100 class 11 physics CBSE
There are 720 permutations of the digits 1 2 3 4 5 class 11 maths CBSE
Discuss the various forms of bacteria class 11 biology CBSE
Draw a diagram of a plant cell and label at least eight class 11 biology CBSE
State the laws of reflection of light
Explain zero factorial class 11 maths CBSE