


Plot the graph of line x = 5.
Answer
570.6k+ views
Hint: First of all, try to recollect the meaning of abscissa and ordinate in a coordinate plane. Now, plot the given line on the coordinate plane by joining at least two points having x = 5.
Complete step-by-step solution:
In this question, we have to plot the graph of line x = 5. Before proceeding with the question, let us understand a few terms.
(A) Coordinate Plane: A coordinate plane is a two-dimensional number line where we call the vertical line as y-axis and the horizontal line the x-axis. These lines are perpendicular and intersect at (0, 0) or origin. These axes divide the whole plane into 4 quadrants as follows.
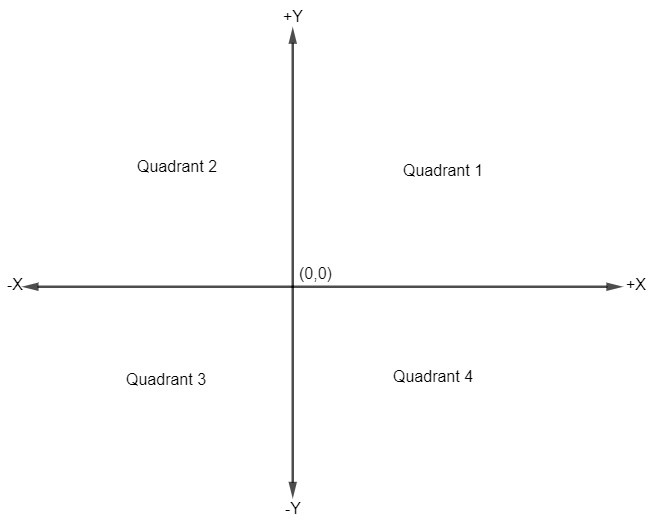
We plot the points on the coordinate plane in the form of (X, Y). The first number corresponds to x – coordinate and the second to y – coordinate.
(B) Abscissa of a Point: It is nothing but the distance of the point from the y-axis or we can also say that it is the x – coordinate of a point \[x=\alpha \] means this point is at \[\alpha \] distance from y-axis.
(C) Ordinate of a Point: It is the distance of a point from the x-axis or we can say that it is the y – coordinate of a point. \[y=\beta \] means this point is at \[\beta \] distance from x-axis.
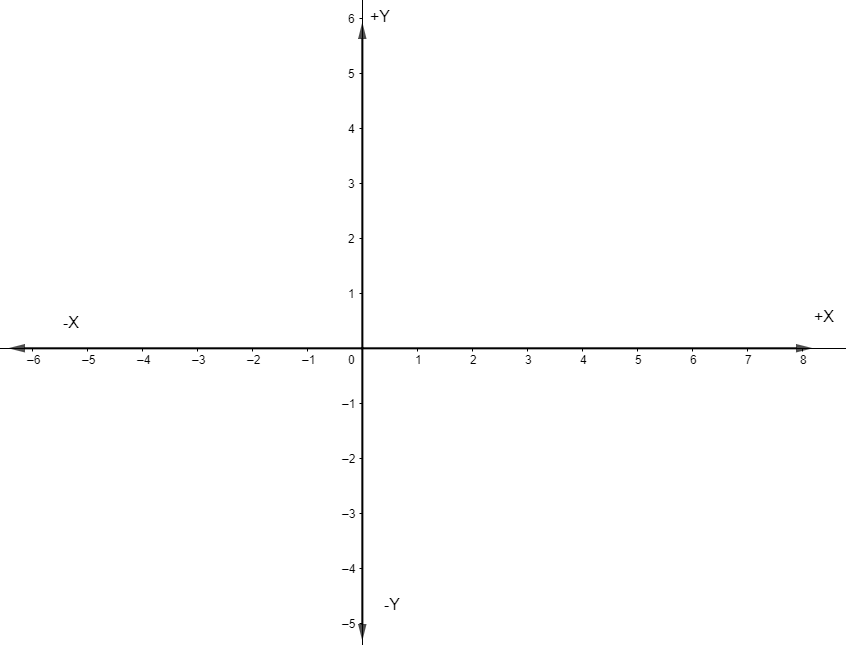
Now let us consider our question. Here, we have to plot a line x = 5. As we know that the line is nothing but often described as the shortest distance between the two points. So, here also in the coordinate plane, we will mark any two points where x = 5 and join them to get the required line. Let us first draw a coordinate plane and label it as follows.
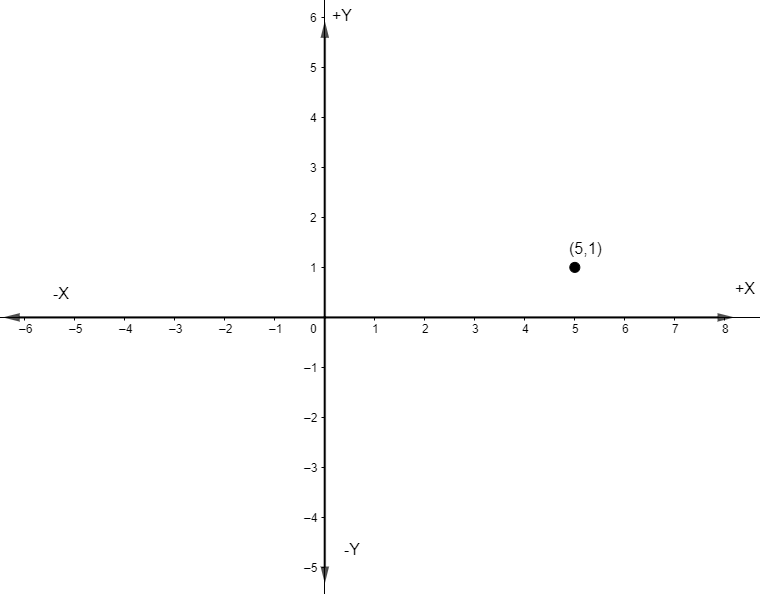
Here we just need to take x = 5 and we can take any point for y – coordinate. So, let us first plot the point (5, 1), that is x = 5, y = 1.
Now, let us plot another point (5, 3), i.e. x = 5 and y = 3 and join it with the previous point and extend it to get the line x = 5, and label it as AB.
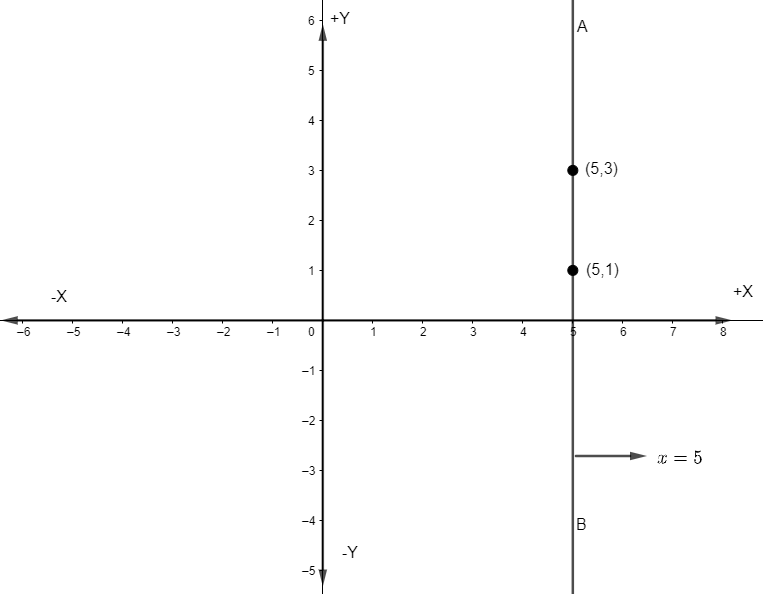
AB is our required line and each point on this line has x – coordinate as 5, that’s why the equation of this line is x = 5.
Note: Students can remember that x = constant is a line parallel to y-axis and y = constant is a line parallel to the x-axis and plot them accordingly. Also, students often have a misconception that x – coordinate is a distance from the x-axis and y – coordinate is a distance from the y-axis which is wrong because x – coordinate is the distance from the y-axis and y – coordinate is the distance from the x-axis. So, this must be kept in mind.
Complete step-by-step solution:
In this question, we have to plot the graph of line x = 5. Before proceeding with the question, let us understand a few terms.
(A) Coordinate Plane: A coordinate plane is a two-dimensional number line where we call the vertical line as y-axis and the horizontal line the x-axis. These lines are perpendicular and intersect at (0, 0) or origin. These axes divide the whole plane into 4 quadrants as follows.
We plot the points on the coordinate plane in the form of (X, Y). The first number corresponds to x – coordinate and the second to y – coordinate.
(B) Abscissa of a Point: It is nothing but the distance of the point from the y-axis or we can also say that it is the x – coordinate of a point \[x=\alpha \] means this point is at \[\alpha \] distance from y-axis.
(C) Ordinate of a Point: It is the distance of a point from the x-axis or we can say that it is the y – coordinate of a point. \[y=\beta \] means this point is at \[\beta \] distance from x-axis.
Now let us consider our question. Here, we have to plot a line x = 5. As we know that the line is nothing but often described as the shortest distance between the two points. So, here also in the coordinate plane, we will mark any two points where x = 5 and join them to get the required line. Let us first draw a coordinate plane and label it as follows.
Here we just need to take x = 5 and we can take any point for y – coordinate. So, let us first plot the point (5, 1), that is x = 5, y = 1.
Now, let us plot another point (5, 3), i.e. x = 5 and y = 3 and join it with the previous point and extend it to get the line x = 5, and label it as AB.
AB is our required line and each point on this line has x – coordinate as 5, that’s why the equation of this line is x = 5.
Note: Students can remember that x = constant is a line parallel to y-axis and y = constant is a line parallel to the x-axis and plot them accordingly. Also, students often have a misconception that x – coordinate is a distance from the x-axis and y – coordinate is a distance from the y-axis which is wrong because x – coordinate is the distance from the y-axis and y – coordinate is the distance from the x-axis. So, this must be kept in mind.
Recently Updated Pages
Master Class 9 General Knowledge: Engaging Questions & Answers for Success
Master Class 9 Social Science: Engaging Questions & Answers for Success
Master Class 9 English: Engaging Questions & Answers for Success
Master Class 9 Maths: Engaging Questions & Answers for Success
Master Class 9 Science: Engaging Questions & Answers for Success
Class 9 Question and Answer - Your Ultimate Solutions Guide
Trending doubts
Difference Between Plant Cell and Animal Cell
Fill the blanks with the suitable prepositions 1 The class 9 english CBSE
Who is eligible for RTE class 9 social science CBSE
Which places in India experience sunrise first and class 9 social science CBSE
What is pollution? How many types of pollution? Define it
Name 10 Living and Non living things class 9 biology CBSE