


How do you plot the line $y=2x-10$ on a graph?
Answer
562.8k+ views
Hint: We start solving the problem by recalling the fact that we need at least two points to draw a line. We then find the point at which the given line intersects the y-axis by using the fact that the value of x-coordinate on the y-axis is zero. We then find the point at which the given line intersects x-axis by using the fact that the value of y-coordinate on the x-axis is zero. We then represent these two points on the plot and then join those points to get the required plot.
Complete step by step answer:
According to the problem, we are asked to plot the given function $y=2x-10$ on a graph.
We can see that the given equation $y=2x-10$ resembles the slope form of the equation of the line $y=mx+c$.
We know that in order to draw a line, we at least need two points. So, let us find the points at which the given line intersects x-axis and y-axis.
Now, let us find the point at which the line intersects the y-axis. We know that the value of x-coordinate on the y-axis is zero. Let us substitute $x=0$ in the given equation to find the intersection point.
So, we get $y=2\left( 0 \right)-10$.
$\Rightarrow y=0-10$.
$\Rightarrow y=-10$.
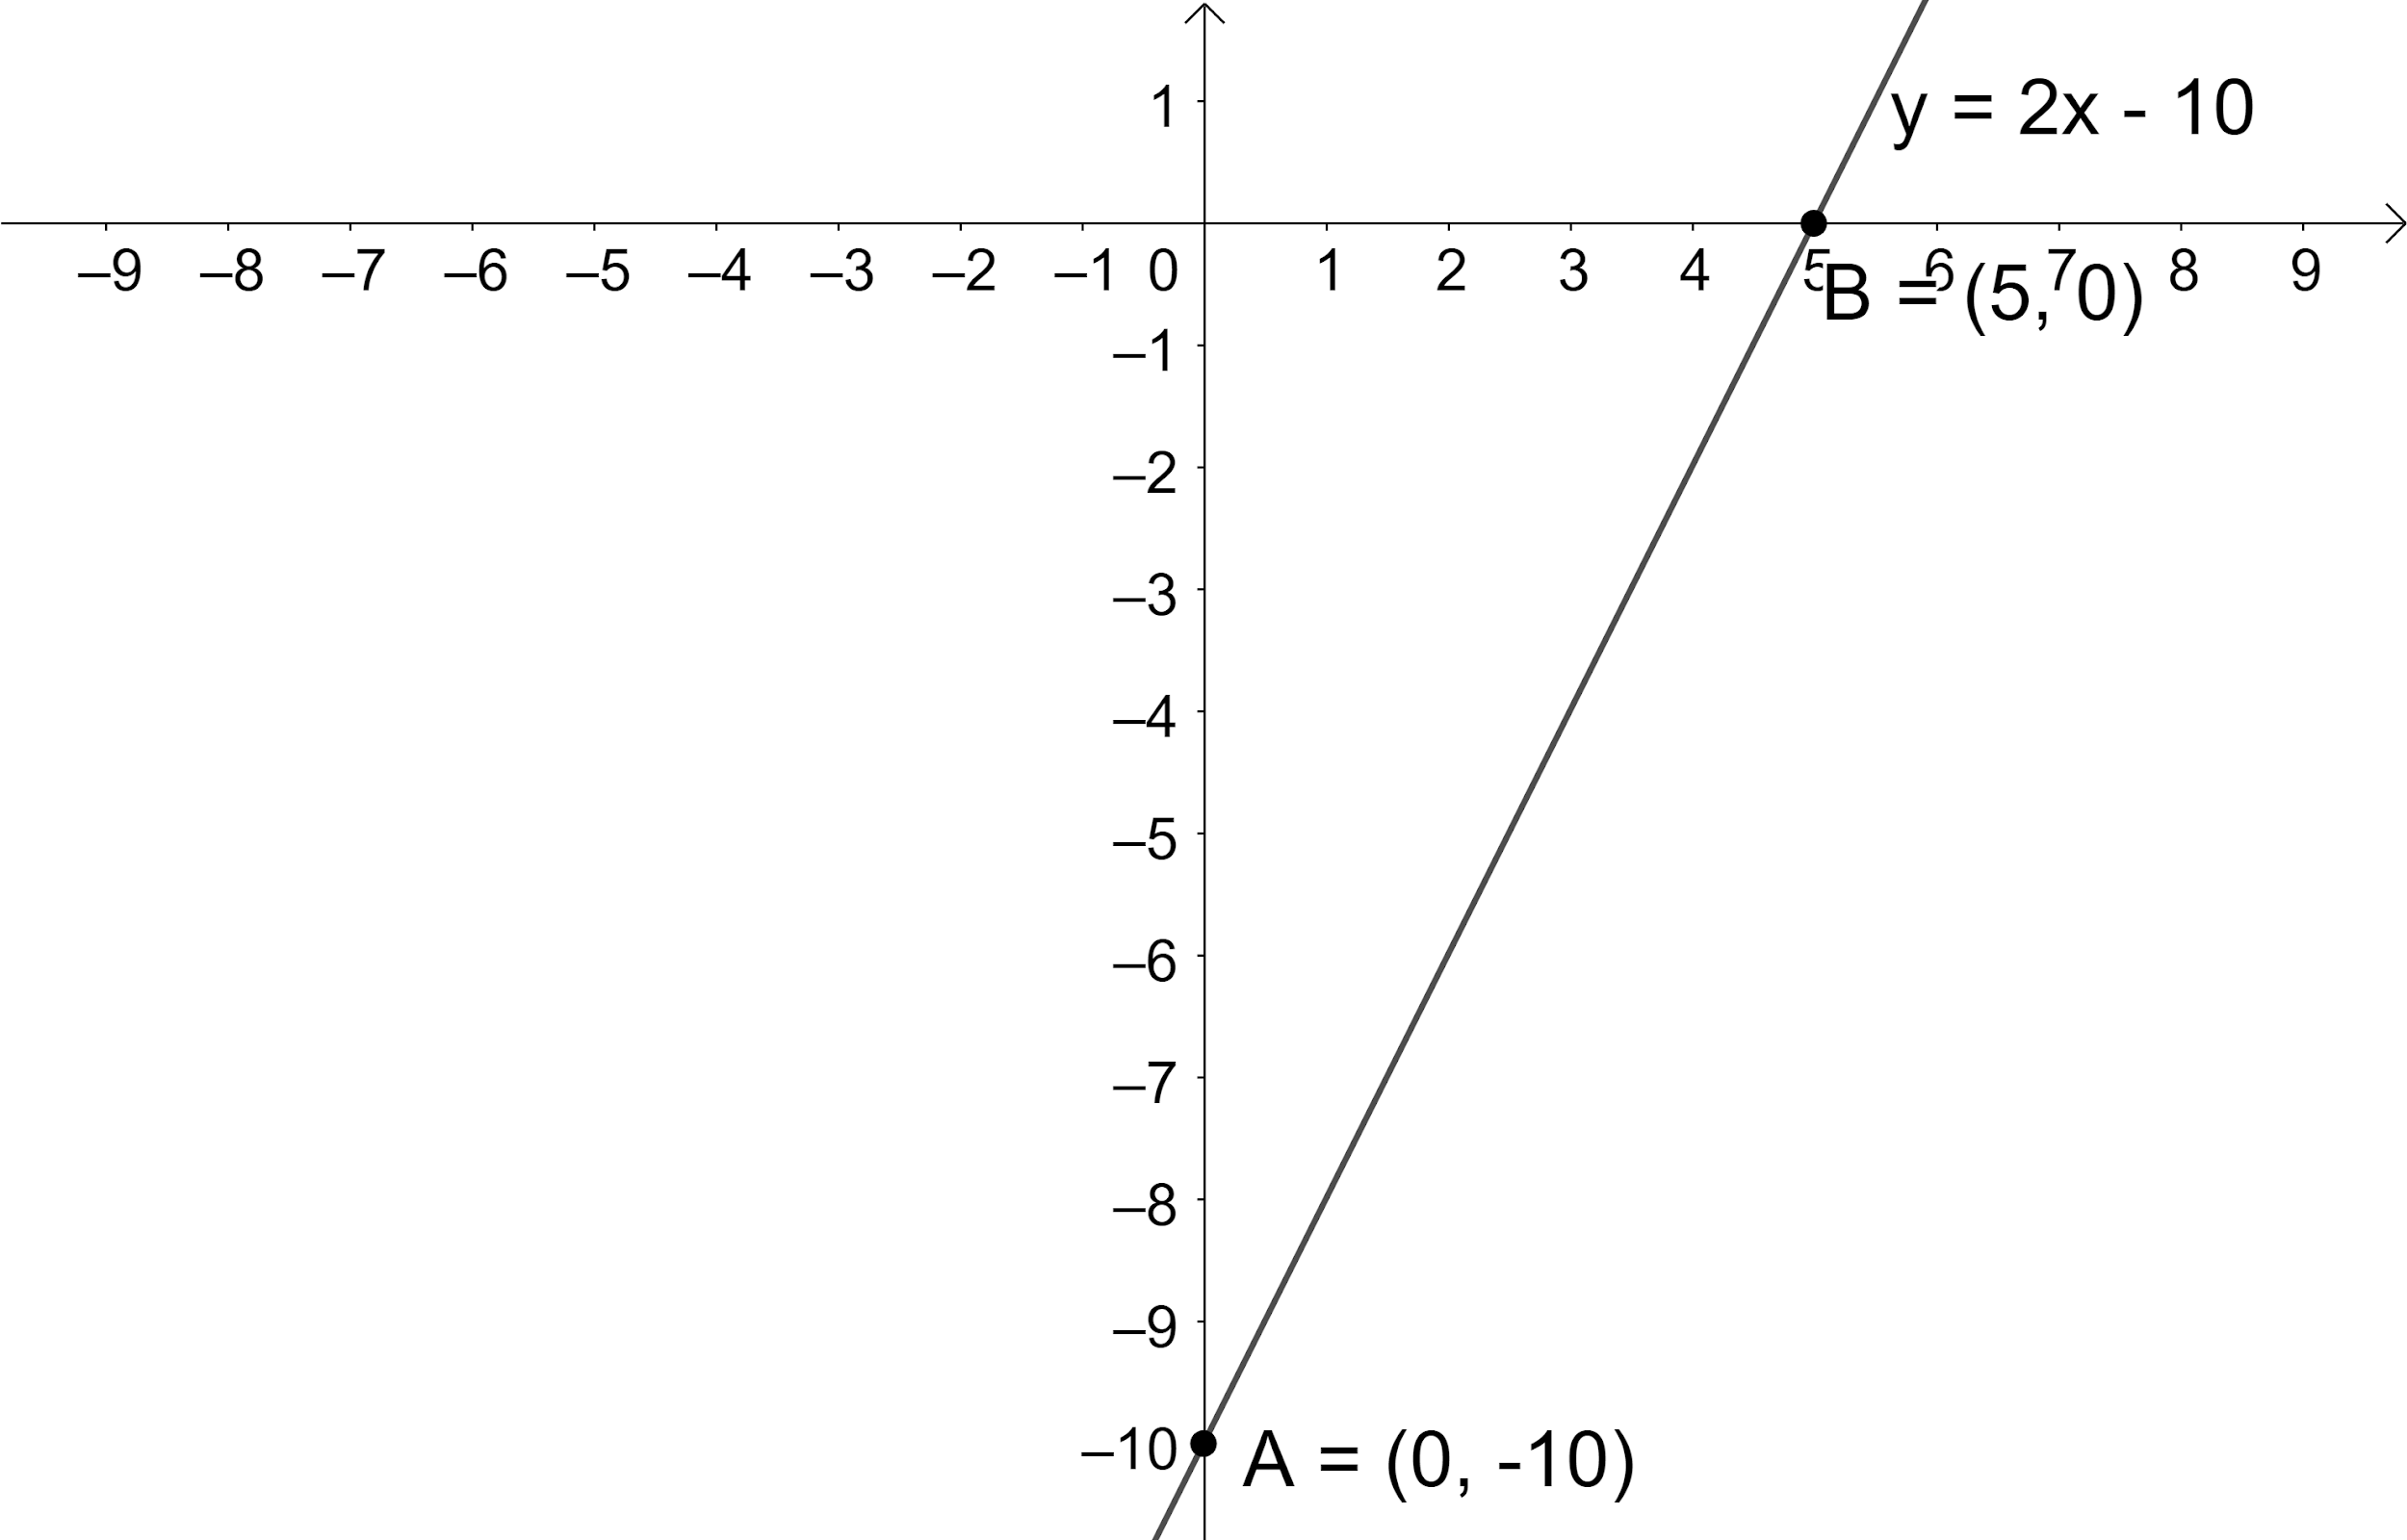
So, the intersection point of the line $y=2x-10$ with y-axis is $A\left( 0,-10 \right)$.
Now, let us find the point at which the line intersects the x-axis. We know that the value of y-coordinate on the x-axis is zero. Let us substitute $y=0$ in the given equation to find the intersection point.
So, we get $0=2x-10$.
$\Rightarrow 2x=10$.
$\Rightarrow x=\dfrac{10}{2}$.
$\Rightarrow x=5$.
So, the intersection point of the line $y=2x-10$ with x-axis is $B\left( 5,0 \right)$.
Now, let us plot the given line by representing and joining the obtained two points on the graph which is as shown below:
Note: Whenever we get this type of problems, we first try to find the points at which the given curve intersects both the axes. We can also plot the given equation by assuming the values for x to find the points which will help to plot on the graph. Similarly, we can expect problems to plot the function $y=10x+30$ on the graph.
Complete step by step answer:
According to the problem, we are asked to plot the given function $y=2x-10$ on a graph.
We can see that the given equation $y=2x-10$ resembles the slope form of the equation of the line $y=mx+c$.
We know that in order to draw a line, we at least need two points. So, let us find the points at which the given line intersects x-axis and y-axis.
Now, let us find the point at which the line intersects the y-axis. We know that the value of x-coordinate on the y-axis is zero. Let us substitute $x=0$ in the given equation to find the intersection point.
So, we get $y=2\left( 0 \right)-10$.
$\Rightarrow y=0-10$.
$\Rightarrow y=-10$.
So, the intersection point of the line $y=2x-10$ with y-axis is $A\left( 0,-10 \right)$.
Now, let us find the point at which the line intersects the x-axis. We know that the value of y-coordinate on the x-axis is zero. Let us substitute $y=0$ in the given equation to find the intersection point.
So, we get $0=2x-10$.
$\Rightarrow 2x=10$.
$\Rightarrow x=\dfrac{10}{2}$.
$\Rightarrow x=5$.
So, the intersection point of the line $y=2x-10$ with x-axis is $B\left( 5,0 \right)$.
Now, let us plot the given line by representing and joining the obtained two points on the graph which is as shown below:
Note: Whenever we get this type of problems, we first try to find the points at which the given curve intersects both the axes. We can also plot the given equation by assuming the values for x to find the points which will help to plot on the graph. Similarly, we can expect problems to plot the function $y=10x+30$ on the graph.

Recently Updated Pages
Master Class 9 General Knowledge: Engaging Questions & Answers for Success
Master Class 9 Social Science: Engaging Questions & Answers for Success
Master Class 9 English: Engaging Questions & Answers for Success
Master Class 9 Maths: Engaging Questions & Answers for Success
Master Class 9 Science: Engaging Questions & Answers for Success
Class 9 Question and Answer - Your Ultimate Solutions Guide
Trending doubts
Difference Between Plant Cell and Animal Cell
Fill the blanks with the suitable prepositions 1 The class 9 english CBSE
Who is eligible for RTE class 9 social science CBSE
Which places in India experience sunrise first and class 9 social science CBSE
What is pollution? How many types of pollution? Define it
Name 10 Living and Non living things class 9 biology CBSE