


Plot the point(5,0) on the graph paper.
Answer
548.7k+ views
Hint: The above question is based on the plotting of the given point on the graph using x - y Cartesian plane.
When we are supposed to plot the point on the graph paper the first given point represents the x axis and the other one y axis.
Using the above hint we will solve the given problem.
Complete step by step solution:
Let's discuss graphs in more details and then we will plot the graph.
Graph of a function f is the set of ordered pairs, where f(x)=y. In the common case where x and f(x) are real numbers, these pairs are Cartesian coordinates of points in two dimensional space. The graph of a function is a special case of a relation.
The points given to us have coordinates for x and y both.
5 represents the coordinate of x and 0 represents the coordinates of y.
In order to plot the point (5,0) on the x-y plane we will mark the point of x axis on x axis and of y axis on y axis. In the graph we observe that the coordinate of y axis is zero and of x axis is 5 and thus we draw a straight line on point 5.
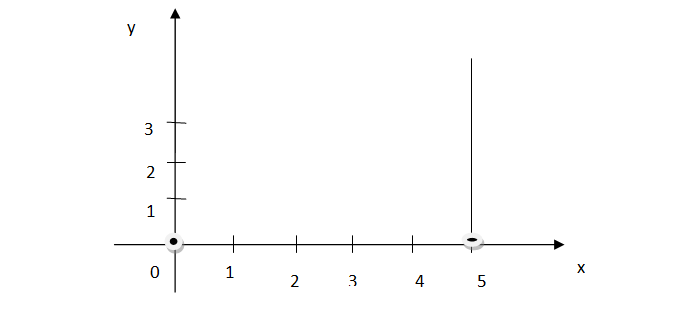
We have obtained the graph.
Note: Graphs are of different types and have many applications. Graphs can be exponential, sinusoidal, linear graphs, logarithmic graphs, parabolic graphs, asymptotic graphs etc. Graph used in Physics, mathematics and in almost every field for representing information in a reduced and simplified manner, without written statements.
When we are supposed to plot the point on the graph paper the first given point represents the x axis and the other one y axis.
Using the above hint we will solve the given problem.
Complete step by step solution:
Let's discuss graphs in more details and then we will plot the graph.
Graph of a function f is the set of ordered pairs, where f(x)=y. In the common case where x and f(x) are real numbers, these pairs are Cartesian coordinates of points in two dimensional space. The graph of a function is a special case of a relation.
The points given to us have coordinates for x and y both.
5 represents the coordinate of x and 0 represents the coordinates of y.
In order to plot the point (5,0) on the x-y plane we will mark the point of x axis on x axis and of y axis on y axis. In the graph we observe that the coordinate of y axis is zero and of x axis is 5 and thus we draw a straight line on point 5.
We have obtained the graph.
Note: Graphs are of different types and have many applications. Graphs can be exponential, sinusoidal, linear graphs, logarithmic graphs, parabolic graphs, asymptotic graphs etc. Graph used in Physics, mathematics and in almost every field for representing information in a reduced and simplified manner, without written statements.

Recently Updated Pages
Master Class 9 General Knowledge: Engaging Questions & Answers for Success
Master Class 9 Social Science: Engaging Questions & Answers for Success
Master Class 9 English: Engaging Questions & Answers for Success
Master Class 9 Maths: Engaging Questions & Answers for Success
Master Class 9 Science: Engaging Questions & Answers for Success
Class 9 Question and Answer - Your Ultimate Solutions Guide
Trending doubts
Difference Between Plant Cell and Animal Cell
Fill the blanks with the suitable prepositions 1 The class 9 english CBSE
Who is eligible for RTE class 9 social science CBSE
Which places in India experience sunrise first and class 9 social science CBSE
What is pollution? How many types of pollution? Define it
Name 10 Living and Non living things class 9 biology CBSE