


Question refers to the following heat curve for water: Which part of the graph shows the greatest amount of energy is required to change the phase?
A.$(A)$
B.$(B)$
C.$(C)$
D.$(D)$
E.$(E)$
Answer
524.4k+ views
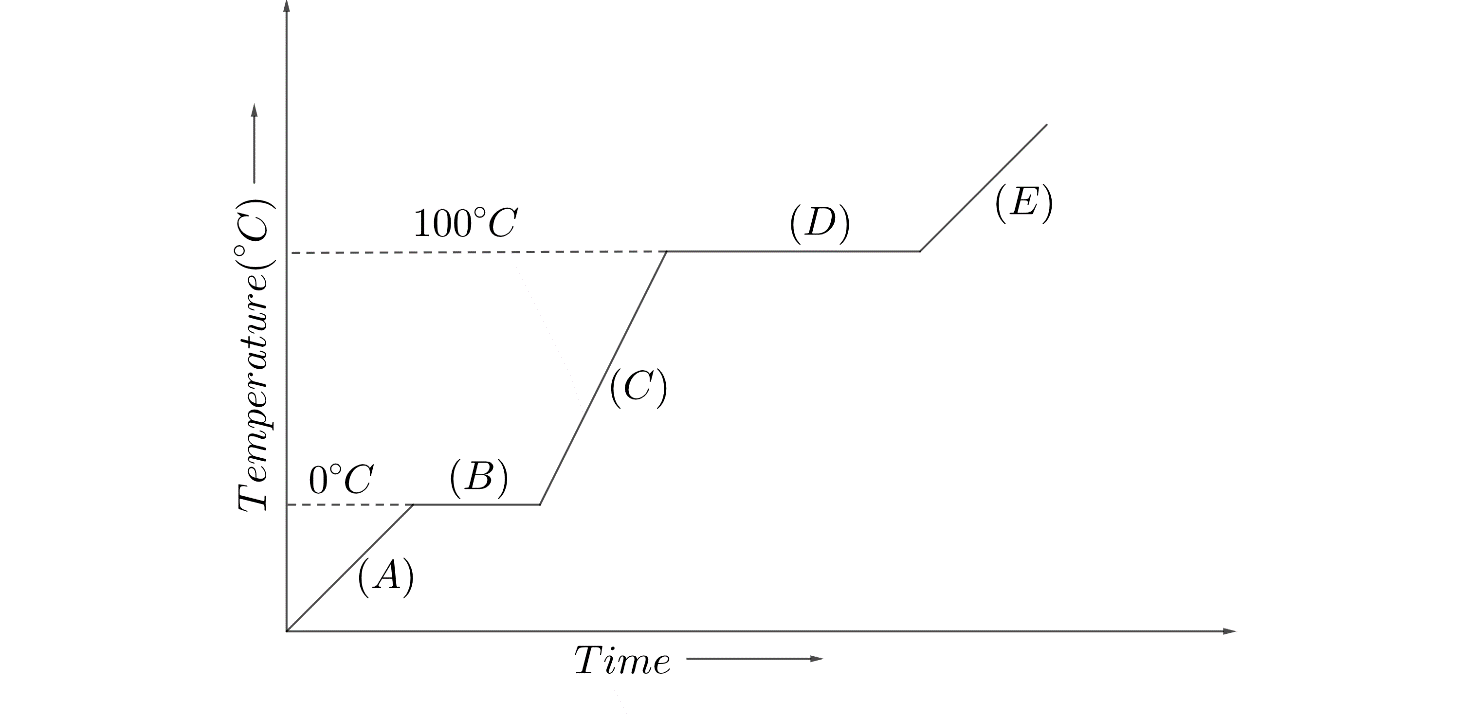
Hint: We can understand from the graph that the slanting lines show the increase in temperature of water and the horizontal lines show constant temperature with time. Also the horizontal lines mark the temperatures ${{0}^\circ}C$ and ${{100}^\circ}C$ , which we know are the melting and boiling points of water at atmospheric pressure. Hence, the horizontal lines signify the change of phase.
Complete answer:
Let us interpret the given graph to understand the energy consumption.
The given graph is temperature versus time graph for water, which shows the trend of increase in temperature with time.
The graph starts from below ${{0}^\circ}C$ , hence the physical state of water will be in the form of ice.
On increasing temperature of ice will increase maintaining the ice form till the temperature reaches ${{0}^\circ}C$ , which is shown by line $(A)$
${{0}^\circ}C$ is known as the melting point of water at standard pressure. At this point ice gets converted to water. But the change is not instant, rather it is a process.
At ${{0}^\circ}C$ , the ice starts melting due to the energy given. Till the ice is completely converted to water, the energy provided will be used up in the change of phase, and no energy will be available for increased temperature. Hence, till phase change process completes, the temperature of the system remains constant which is shown by line $(B)$
After all the ice has melted to water, the energy provided as heat will start heating the water, leading to increase in temperature of water without any phase change till it reaches ${{100}^\circ}C$ which is shown by line $(C)$
${{100}^\circ}C$ is known as the boiling point of water at standard pressure. At this point water gets converted to steam and as we have understood previously, it will be a process.
At ${{100}^\circ}C$ , water will start boiling due to the energy given as heat. And as we know that no extra energy will be available, the temperature of the system will remain constant till it completely converts to steam which is shown by line $(D)$
After water is converted to steam, the heat will only increase the temperature of the steam which is shown by the line $(E)$
The heat required to convert ice to water at melting point is known as Latent heat of fusion. The latent heat of fusion for water = $336kJkg^{-1}$
The heat required to convert water to steam at boiling point is known as Latent heat of evaporation. The latent heat of evaporation for water = $2260kJkg^{-1}$
Hence, as we are required the energy for phase change, the lines $(A)$ , $(C)$ , and $(E)$ are not to be considered. Out of the lines $(B)$ and $(D)$ , as we can see from the values and from the graph, the maximum energy required will be for vaporisation at line $(D)$
Hence, the correct answer is Option $(D)$
Note:
We should remember the fact that phase change always occurs at constant temperature. Till the complete volume of water or any other liquid does not change the phase completely, temperature does not change. Also, phase change starts at a particular temperature only. Hence, the slanting lines signify only the change in temperature, but throughout the temperature change, the phase will be the same.
Recently Updated Pages
Master Class 12 Economics: Engaging Questions & Answers for Success
Master Class 12 Physics: Engaging Questions & Answers for Success
Master Class 12 English: Engaging Questions & Answers for Success
Master Class 12 Social Science: Engaging Questions & Answers for Success
Master Class 12 Maths: Engaging Questions & Answers for Success
Master Class 12 Business Studies: Engaging Questions & Answers for Success
Trending doubts
Which are the Top 10 Largest Countries of the World?
What are the major means of transport Explain each class 12 social science CBSE
Draw a labelled sketch of the human eye class 12 physics CBSE
Why cannot DNA pass through cell membranes class 12 biology CBSE
Differentiate between insitu conservation and exsitu class 12 biology CBSE
Draw a neat and well labeled diagram of TS of ovary class 12 biology CBSE