


Read the bar graph shown in the below and answer the following questions:
What is the information given by the bar graph?
Answer
516.9k+ views
Hint: A bar graph is a visual tool that uses bars to compare data among categories. It may run horizontally or vertically. It consists of two axes. On a vertical bar graph, the horizontal axis (or x-axis) shows the data categories. The vertical axis (or y-axis) is the scale. The Y-axis holds the measure of the variable. The height of the bars corresponds to the value of the variables. The information depicted in the given bar graph can be found by reading the X-axis and Y-axis labels.
Complete step by step answer:
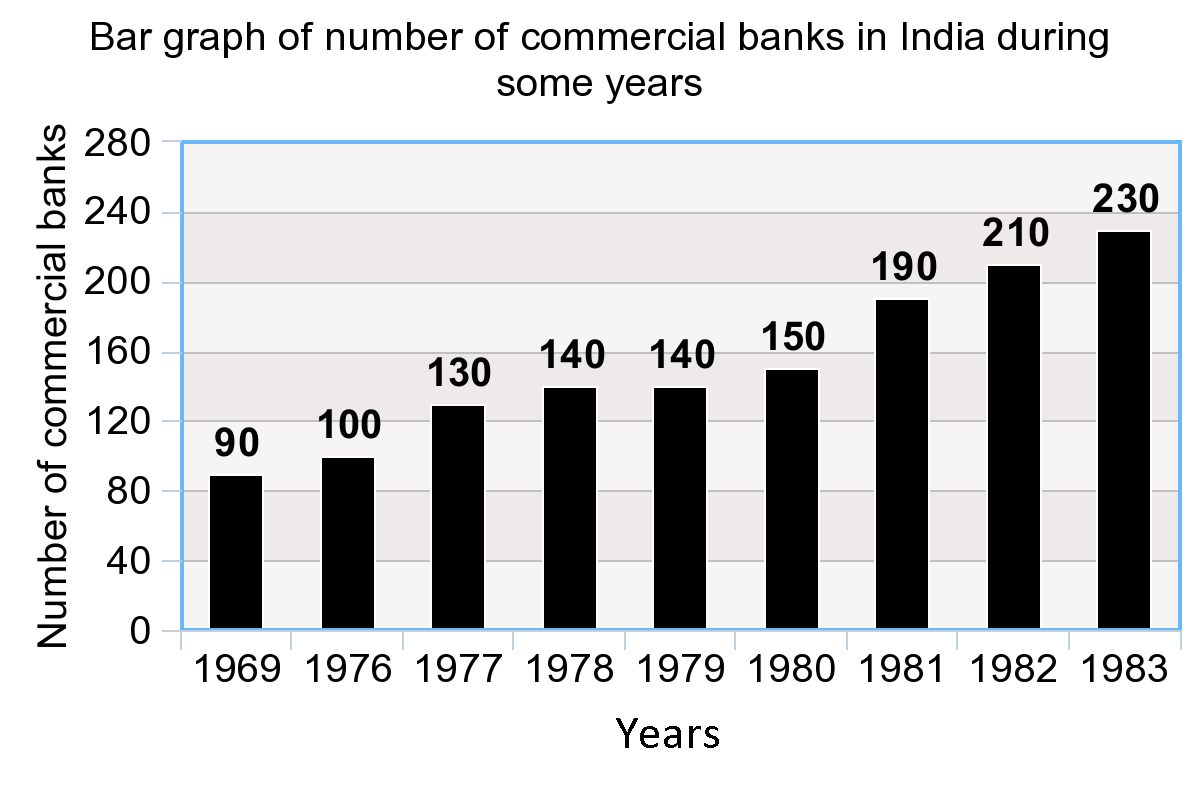
We have to find the information given by the bar graph. Let us recollect what a bar graph is and how to read data from a bar graph. We know that a bar graph or bar chart or bar diagram is a visual tool that uses bars to compare data among categories. A bar graph may run horizontally or vertically. We know that bar graphs consist of two axes. On a vertical bar graph, the horizontal axis (or x-axis) shows the data categories. The vertical axis (or y-axis) is the scale. The Y-axis holds the measure of the variable. We know that the height of the bars corresponds to the value of the variables.
We can find the information depicted in the given bar graph by reading the X-axis and Y-axis labels. The information shown in the given bar graph is the number of commercial banks in India during some years.
Note: Students must read the bar graph carefully. The information depicted in a bar graph can also be found by reading the title of the bar graph. If the title is not given, then we must look into X-axis and Y-axis labels. In a horizontal bar graph, the vertical axis shows the data categories and the horizontal axis shows their measures.
Complete step by step answer:
We have to find the information given by the bar graph. Let us recollect what a bar graph is and how to read data from a bar graph. We know that a bar graph or bar chart or bar diagram is a visual tool that uses bars to compare data among categories. A bar graph may run horizontally or vertically. We know that bar graphs consist of two axes. On a vertical bar graph, the horizontal axis (or x-axis) shows the data categories. The vertical axis (or y-axis) is the scale. The Y-axis holds the measure of the variable. We know that the height of the bars corresponds to the value of the variables.
We can find the information depicted in the given bar graph by reading the X-axis and Y-axis labels. The information shown in the given bar graph is the number of commercial banks in India during some years.
Note: Students must read the bar graph carefully. The information depicted in a bar graph can also be found by reading the title of the bar graph. If the title is not given, then we must look into X-axis and Y-axis labels. In a horizontal bar graph, the vertical axis shows the data categories and the horizontal axis shows their measures.

Recently Updated Pages
Master Class 9 General Knowledge: Engaging Questions & Answers for Success
Master Class 9 Social Science: Engaging Questions & Answers for Success
Master Class 9 English: Engaging Questions & Answers for Success
Master Class 9 Maths: Engaging Questions & Answers for Success
Master Class 9 Science: Engaging Questions & Answers for Success
Class 9 Question and Answer - Your Ultimate Solutions Guide
Trending doubts
Difference Between Plant Cell and Animal Cell
Fill the blanks with the suitable prepositions 1 The class 9 english CBSE
Who is eligible for RTE class 9 social science CBSE
Which places in India experience sunrise first and class 9 social science CBSE
What is pollution? How many types of pollution? Define it
Name 10 Living and Non living things class 9 biology CBSE