


What is the relationship between the normal curve and the standard deviation?
Answer
527.1k+ views
Hint: In this problem, we can see the relationship between the normal curve and the standard deviation. We should know that the graph of the normal distribution depends upon two factors, the mean and the standard deviation, where the mean of the distribution determines the location of the centre of the graph and the standard deviation determines the height and the width of the graph. We can now see about them.
Complete step by step solution:
Here we can see the relationship between the normal curve and the standard deviation.
We should know that the graph of the normal distribution depends upon two factors, the mean and the standard deviation.
The normal distribution curve is the distribution of values around the mean of an evenly dispersed population, where standard deviation is the calculation of the width of that curve based on a sample or a population value. The normal curve is bell shaped and the normal curve is asymptotic to the base line.
The standard normal distribution is a normal distribution with mean, \[\mu =0\] and the standard deviation,\[\sigma =1\].
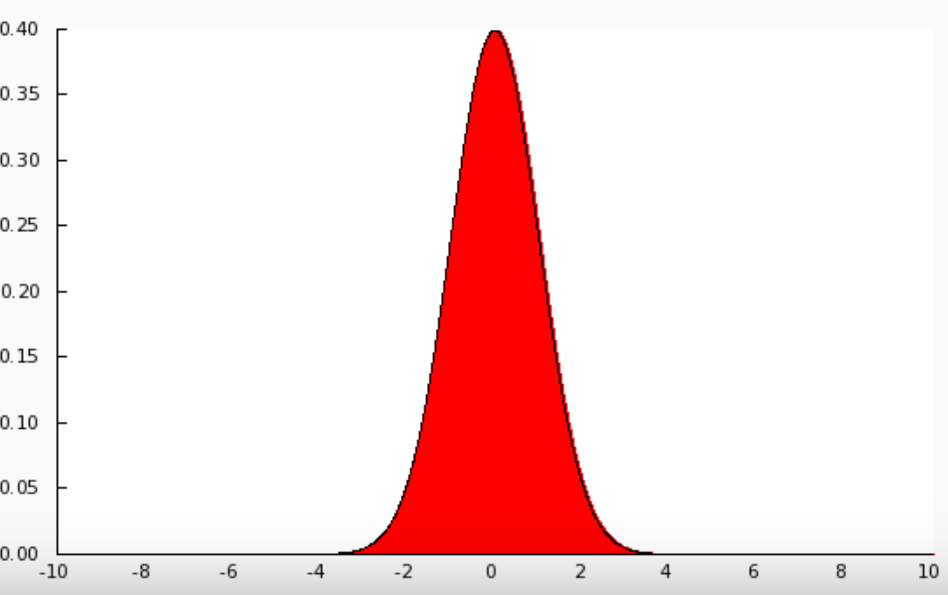
We can see the normal curve here.
Note: We should always remember the normal curve and the standard deviation. We should know that the graph of the normal distribution depends upon two factors, the mean and the standard deviation, where the mean of the distribution determines the location of the centre of the graph and the standard deviation determines the height and the width of the graph. The standard normal distribution is a normal distribution with mean, \[\mu =0\] and the standard deviation,\[\sigma =1\].
Complete step by step solution:
Here we can see the relationship between the normal curve and the standard deviation.
We should know that the graph of the normal distribution depends upon two factors, the mean and the standard deviation.
The normal distribution curve is the distribution of values around the mean of an evenly dispersed population, where standard deviation is the calculation of the width of that curve based on a sample or a population value. The normal curve is bell shaped and the normal curve is asymptotic to the base line.
The standard normal distribution is a normal distribution with mean, \[\mu =0\] and the standard deviation,\[\sigma =1\].
We can see the normal curve here.
Note: We should always remember the normal curve and the standard deviation. We should know that the graph of the normal distribution depends upon two factors, the mean and the standard deviation, where the mean of the distribution determines the location of the centre of the graph and the standard deviation determines the height and the width of the graph. The standard normal distribution is a normal distribution with mean, \[\mu =0\] and the standard deviation,\[\sigma =1\].
Recently Updated Pages
Master Class 11 Computer Science: Engaging Questions & Answers for Success
Master Class 11 Business Studies: Engaging Questions & Answers for Success
Master Class 11 Economics: Engaging Questions & Answers for Success
Master Class 11 English: Engaging Questions & Answers for Success
Master Class 11 Maths: Engaging Questions & Answers for Success
Master Class 11 Biology: Engaging Questions & Answers for Success
Trending doubts
One Metric ton is equal to kg A 10000 B 1000 C 100 class 11 physics CBSE
There are 720 permutations of the digits 1 2 3 4 5 class 11 maths CBSE
Discuss the various forms of bacteria class 11 biology CBSE
Draw a diagram of a plant cell and label at least eight class 11 biology CBSE
State the laws of reflection of light
Explain zero factorial class 11 maths CBSE