


What can you say about the values of \[\sin A\] and \[\cos A\], as the value of angle A increases from \[{{0}^{\circ }}\]to \[{{90}^{\circ }}\]?
Answer
597.3k+ views
Hint: We have to know the domain of \[\sin A\] and \[\cos A\] is \[-1\le A\le +1\]. And use \[\sin A\] and \[\cos A\] as a function to put the value of \[{{0}^{\circ }}\] to \[{{90}^{\circ }}\]to make the graph of \[\sin A\] and \[\cos A\]. After that we can see the value of \[\sin A\] increase when we increase the angle \[{{0}^{\circ }}\] to \[{{90}^{\circ }}\] and for the \[\cos A\] the value decrease when the angle increase \[{{0}^{\circ }}\] to \[{{90}^{\circ }}\].
Complete step by step solution:
The sine and cosine of an angle are all defined in terms of trigonometry, but they can also be expressed as functions.
Firstly for \[\sin A\],
\[\sin A\] function can be defined for any number “A” using a diagram like below.
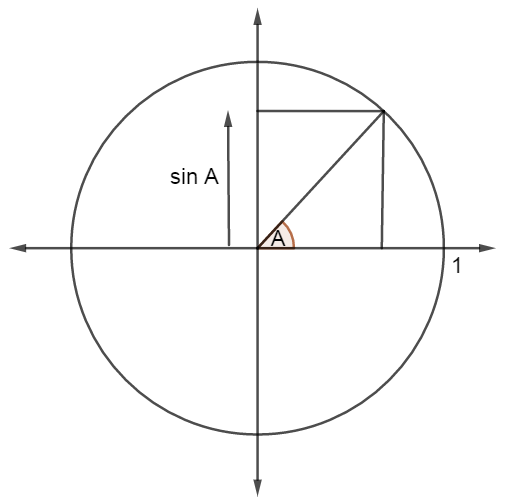
We take a circle with center at the origin, and with radius 1. We then draw a line from the
origin, at A degrees from the horizontal axis, until it meets the circle, so that the line has length
1. We then look at the vertical axis coordinate of the point where the line and the circle meet to find the value of \[\sin A\].
The information from this picture can also be used to see how changing x affects the value of \[\sin A\]. We can use a table of values to plot selected points between \[A={{0}^{\circ }}\] and \[A={{90}^{\circ }}\] and draw a smooth curve between them. We can then extend the graph to the right and to the left, because we know that the graph repeats itself.
For,
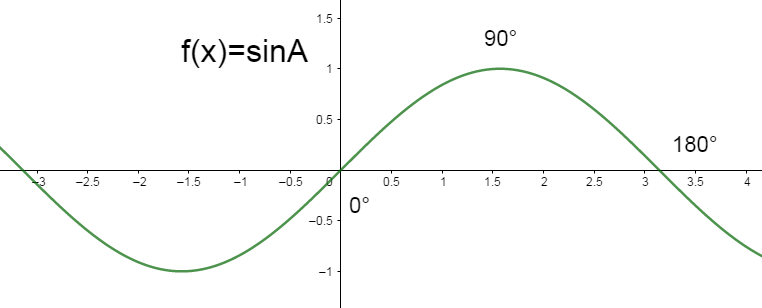
When \[A={{0}^{\circ }}\] , \[\sin A=0\] As we increase A \[{{0}^{\circ }}\] to \[{{90}^{\circ }}\], \[\sin A\] increases to 1. As we increase A further, \[\sin A\] decreases. It becomes zero when \[A={{180}^{\circ }}\].
The function \[\sin A\] has all real numbers in its domain, but its range is \[-1\le A\le +1\].
Now for cosine,
This function can be defined for any number A using a diagram like this.
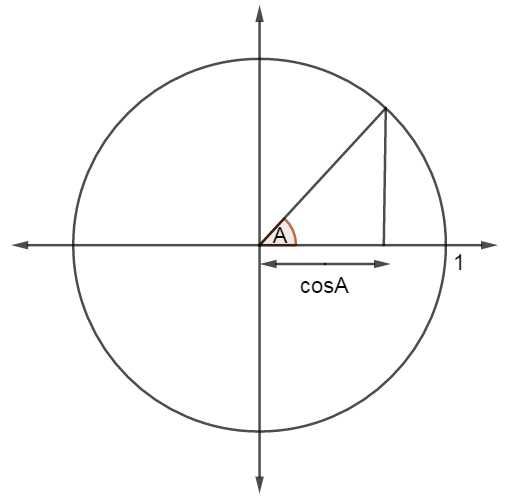
We take a circle diagram similar to the one we used for the sine function. But now we look at the horizontal axis coordinate of the point where the line and the circle meet, to find the value of \[\cos A\].
The information from this picture can also be used to see how changing A affects the value of \[\cos A\]. We can use a table of values to plot selected points between \[A={{0}^{\circ }}\] and \[A={{90}^{\circ }}\] and draw a smooth curve between them. We can then extend the graph to the right and to the left. Because we know that the graph repeats itself.
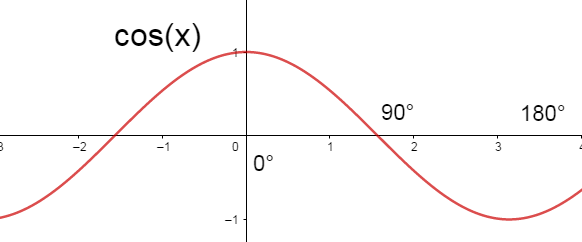
When \[A={{0}^{\circ }}\] , \[\cos A=1\] As we increase A \[{{0}^{\circ }}\] to \[{{90}^{\circ }}\], \[\cos A\] decrease to 0.
The function \[\cos A\] has all real numbers in its domain, but its range is \[-1\le A\le +1\].
Note: We can increase the value of A further and see \[\sin A\] decreases. It becomes zero when \[A={{180}^{\circ }}\]. It then continues to decrease, and becomes −1 when \[A={{270}^{\circ }}\]. After that \[\sin A\]increases and becomes zero again when A reaches \[{{360}^{\circ }}\]. And for \[\cos A\] when we increase the value of A further and see \[\cos A\] decreases. It becomes -1 when \[A={{180}^{\circ }}\] and then increases and becomes 1 when A reaches \[{{360}^{\circ }}\].
Complete step by step solution:
The sine and cosine of an angle are all defined in terms of trigonometry, but they can also be expressed as functions.
Firstly for \[\sin A\],
\[\sin A\] function can be defined for any number “A” using a diagram like below.
We take a circle with center at the origin, and with radius 1. We then draw a line from the
origin, at A degrees from the horizontal axis, until it meets the circle, so that the line has length
1. We then look at the vertical axis coordinate of the point where the line and the circle meet to find the value of \[\sin A\].
The information from this picture can also be used to see how changing x affects the value of \[\sin A\]. We can use a table of values to plot selected points between \[A={{0}^{\circ }}\] and \[A={{90}^{\circ }}\] and draw a smooth curve between them. We can then extend the graph to the right and to the left, because we know that the graph repeats itself.
For,
| A | \[{{0}^{\circ }}\] | \[{{45}^{\circ }}\] | \[{{90}^{\circ }}\] |
| \[\sin A\] | 0 | 0.71 | 1 |
When \[A={{0}^{\circ }}\] , \[\sin A=0\] As we increase A \[{{0}^{\circ }}\] to \[{{90}^{\circ }}\], \[\sin A\] increases to 1. As we increase A further, \[\sin A\] decreases. It becomes zero when \[A={{180}^{\circ }}\].
The function \[\sin A\] has all real numbers in its domain, but its range is \[-1\le A\le +1\].
Now for cosine,
This function can be defined for any number A using a diagram like this.
We take a circle diagram similar to the one we used for the sine function. But now we look at the horizontal axis coordinate of the point where the line and the circle meet, to find the value of \[\cos A\].
The information from this picture can also be used to see how changing A affects the value of \[\cos A\]. We can use a table of values to plot selected points between \[A={{0}^{\circ }}\] and \[A={{90}^{\circ }}\] and draw a smooth curve between them. We can then extend the graph to the right and to the left. Because we know that the graph repeats itself.
| A | \[{{0}^{\circ }}\] | \[{{45}^{\circ }}\] | \[{{90}^{\circ }}\] |
| \[\cos A\] | 1 | 0.71 | 0 |
When \[A={{0}^{\circ }}\] , \[\cos A=1\] As we increase A \[{{0}^{\circ }}\] to \[{{90}^{\circ }}\], \[\cos A\] decrease to 0.
The function \[\cos A\] has all real numbers in its domain, but its range is \[-1\le A\le +1\].
Note: We can increase the value of A further and see \[\sin A\] decreases. It becomes zero when \[A={{180}^{\circ }}\]. It then continues to decrease, and becomes −1 when \[A={{270}^{\circ }}\]. After that \[\sin A\]increases and becomes zero again when A reaches \[{{360}^{\circ }}\]. And for \[\cos A\] when we increase the value of A further and see \[\cos A\] decreases. It becomes -1 when \[A={{180}^{\circ }}\] and then increases and becomes 1 when A reaches \[{{360}^{\circ }}\].
Recently Updated Pages
Master Class 10 Computer Science: Engaging Questions & Answers for Success
Master Class 10 General Knowledge: Engaging Questions & Answers for Success
Master Class 10 English: Engaging Questions & Answers for Success
Master Class 10 Social Science: Engaging Questions & Answers for Success
Master Class 10 Maths: Engaging Questions & Answers for Success
Master Class 10 Science: Engaging Questions & Answers for Success
Trending doubts
What is the median of the first 10 natural numbers class 10 maths CBSE
Which women's tennis player has 24 Grand Slam singles titles?
Who is the Brand Ambassador of Incredible India?
Why is there a time difference of about 5 hours between class 10 social science CBSE
Write a letter to the principal requesting him to grant class 10 english CBSE
A moving boat is observed from the top of a 150 m high class 10 maths CBSE