


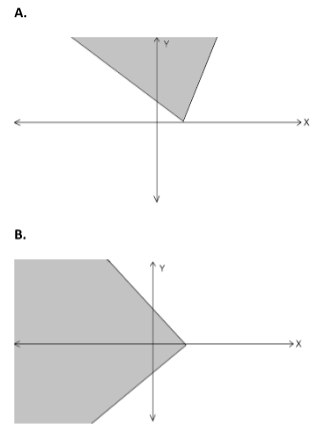
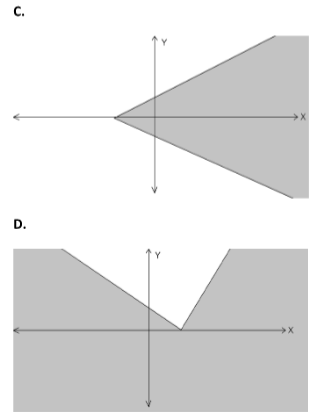
Select from the following which represents the shaded regions show the graph of the inequality\[y \leqslant \left| {x - 2} \right|\].
Answer
578.4k+ views
Hint: We solve the inequality given by dividing it into two parts on opening the modulus values. Form two equations and find the two points for each equation so as to form a line. Plot the lines on the graph and choose the suitable option after shading the required region.
* Modulus of a function ‘x’ opens up as \[\left| x \right| = \left\{ {\begin{array}{*{20}{c}}
x&{;x \geqslant 0} \\
{ - x}&{;x < 0}
\end{array}} \right.\]
Complete step-by-step answer:
We are given the inequality \[y \leqslant \left| {x - 2} \right|\]
We solve the RHS of the inequality using the method of modulus
CASE 1:
\[(x - 2)\] is negative
Use the definition of modulus i.e. \[\left| x \right| = \left\{ {\begin{array}{*{20}{c}}
x&{;x \geqslant 0} \\
{ - x}&{;x < 0}
\end{array}} \right.\]
\[ \Rightarrow \left| {x - 2} \right| = - (x - 2)\]
Multiply negative sign inside the bracket
\[ \Rightarrow \left| {x - 2} \right| = - x + 2\]
\[\therefore \]Equation becomes \[y = - x + 2\] …………..… (1)
Now we find two points which will help us to plot the line of the equation.
When \[x = 0\]
\[ \Rightarrow y = 0 + 2 = 2\]
The point becomes \[(0,2)\]
Now when \[x = 2\]
\[ \Rightarrow y = - 2 + 2 = 0\]
The point becomes \[(2,0)\]
So, the equation of line \[y = - x + 2\]has points \[(2,0)\]and\[(0,2)\]
CASE 2:
\[(x - 2)\] is positive
Use the definition of modulus i.e. \[\left| x \right| = \left\{ {\begin{array}{*{20}{c}}
x&{;x \geqslant 0} \\
{ - x}&{;x < 0}
\end{array}} \right.\]
\[ \Rightarrow \left| {x - 2} \right| = (x - 2)\]
\[\therefore \]Equation becomes \[y = x - 2\] … (2)
Now we find two points which will help us to plot the line of the equation.
When \[x = 0\]
\[ \Rightarrow y = 0 - 2 = - 2\]
The point becomes \[(0, - 2)\]
Now when \[x = 2\]
\[ \Rightarrow y = 2 - 2 = 0\]
The point becomes \[(2,0)\]
So, the equation of line \[y = x - 2\] has points \[(2,0)\]and\[(0, - 2)\].
Now we plot the two lines on the graph.
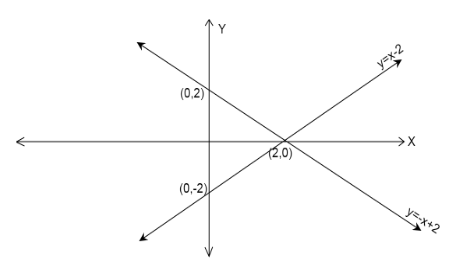
Now we shade the region on the basis of inequality given in the question.
Since, \[y \leqslant \left| {x - 2} \right|\]
\[ \Rightarrow y \leqslant x - 2,y \leqslant 2 - x\]
We check the shaded region in each case by using the point in center\[(0,0)\]. We check if the point
satisfies the equation or not.
From equation (1), equation of line is
\[ \Rightarrow y = - x + 2\]
Substitute the value of \[x = 0,y = 0\]
\[ \Rightarrow 0 = 0 + 2\]
\[ \Rightarrow 0 = 2\]
This is a contradiction, so the shaded region does not contain the point\[(0,0)\].
From equation (2), equation of line is
\[ \Rightarrow y = x - 2\]
Substitute the value of \[x = 0,y = 0\]
\[ \Rightarrow 0 = 0 - 2\]
\[ \Rightarrow 0 = - 2\]
This is a contradiction, so the shaded region does not contain the point\[(0,0)\].
From these conclusions we can reject the graphs given in options: B. C. D. and E.
\[\therefore \]Correct option is option A.
Note: Students many times make the mistake of choosing the wrong options as the graphs given in the options are not complete and they are just the outline of the shaded regions. Keep in mind when drawing the graph of the inequality we get a graph of two intersecting lines, and if we see carefully the gap between two lines is divided into many regions, on shading those regions these options are
given.
* Modulus of a function ‘x’ opens up as \[\left| x \right| = \left\{ {\begin{array}{*{20}{c}}
x&{;x \geqslant 0} \\
{ - x}&{;x < 0}
\end{array}} \right.\]
Complete step-by-step answer:
We are given the inequality \[y \leqslant \left| {x - 2} \right|\]
We solve the RHS of the inequality using the method of modulus
CASE 1:
\[(x - 2)\] is negative
Use the definition of modulus i.e. \[\left| x \right| = \left\{ {\begin{array}{*{20}{c}}
x&{;x \geqslant 0} \\
{ - x}&{;x < 0}
\end{array}} \right.\]
\[ \Rightarrow \left| {x - 2} \right| = - (x - 2)\]
Multiply negative sign inside the bracket
\[ \Rightarrow \left| {x - 2} \right| = - x + 2\]
\[\therefore \]Equation becomes \[y = - x + 2\] …………..… (1)
Now we find two points which will help us to plot the line of the equation.
When \[x = 0\]
\[ \Rightarrow y = 0 + 2 = 2\]
The point becomes \[(0,2)\]
Now when \[x = 2\]
\[ \Rightarrow y = - 2 + 2 = 0\]
The point becomes \[(2,0)\]
So, the equation of line \[y = - x + 2\]has points \[(2,0)\]and\[(0,2)\]
CASE 2:
\[(x - 2)\] is positive
Use the definition of modulus i.e. \[\left| x \right| = \left\{ {\begin{array}{*{20}{c}}
x&{;x \geqslant 0} \\
{ - x}&{;x < 0}
\end{array}} \right.\]
\[ \Rightarrow \left| {x - 2} \right| = (x - 2)\]
\[\therefore \]Equation becomes \[y = x - 2\] … (2)
Now we find two points which will help us to plot the line of the equation.
When \[x = 0\]
\[ \Rightarrow y = 0 - 2 = - 2\]
The point becomes \[(0, - 2)\]
Now when \[x = 2\]
\[ \Rightarrow y = 2 - 2 = 0\]
The point becomes \[(2,0)\]
So, the equation of line \[y = x - 2\] has points \[(2,0)\]and\[(0, - 2)\].
Now we plot the two lines on the graph.
Now we shade the region on the basis of inequality given in the question.
Since, \[y \leqslant \left| {x - 2} \right|\]
\[ \Rightarrow y \leqslant x - 2,y \leqslant 2 - x\]
We check the shaded region in each case by using the point in center\[(0,0)\]. We check if the point
satisfies the equation or not.
From equation (1), equation of line is
\[ \Rightarrow y = - x + 2\]
Substitute the value of \[x = 0,y = 0\]
\[ \Rightarrow 0 = 0 + 2\]
\[ \Rightarrow 0 = 2\]
This is a contradiction, so the shaded region does not contain the point\[(0,0)\].
From equation (2), equation of line is
\[ \Rightarrow y = x - 2\]
Substitute the value of \[x = 0,y = 0\]
\[ \Rightarrow 0 = 0 - 2\]
\[ \Rightarrow 0 = - 2\]
This is a contradiction, so the shaded region does not contain the point\[(0,0)\].
From these conclusions we can reject the graphs given in options: B. C. D. and E.
\[\therefore \]Correct option is option A.
Note: Students many times make the mistake of choosing the wrong options as the graphs given in the options are not complete and they are just the outline of the shaded regions. Keep in mind when drawing the graph of the inequality we get a graph of two intersecting lines, and if we see carefully the gap between two lines is divided into many regions, on shading those regions these options are
given.

Recently Updated Pages
Master Class 9 General Knowledge: Engaging Questions & Answers for Success
Master Class 9 Social Science: Engaging Questions & Answers for Success
Master Class 9 English: Engaging Questions & Answers for Success
Master Class 9 Maths: Engaging Questions & Answers for Success
Master Class 9 Science: Engaging Questions & Answers for Success
Class 9 Question and Answer - Your Ultimate Solutions Guide
Trending doubts
Difference Between Plant Cell and Animal Cell
Fill the blanks with the suitable prepositions 1 The class 9 english CBSE
Who is eligible for RTE class 9 social science CBSE
Which places in India experience sunrise first and class 9 social science CBSE
What is pollution? How many types of pollution? Define it
Name 10 Living and Non living things class 9 biology CBSE