


Show on a graph, the variation of resistivity with temperature for a typical semiconductor.
Answer
579k+ views
Hint: Recall the formula for resistivity for a semiconductor. Deduce how temperature affects the resistivity of a material. After finding out the relation, match it with the standard graphs know and then draw the required graph
Formula Used:
$\rho = \dfrac{m}{{n{e^2}\tau }}$
Complete step by step solution:
The resistivity is given by: $\rho = \dfrac{m}{{n{e^2}\tau }}$ where
$n = $ Number density of electrons
$\tau = $ Relaxation time
With the rise in temperature, the number density of electrons and holes (in case of semiconductors) increases, where τ remains constant. So, ρ (resistivity) decreases with increase in temperature.
From the above, we can infer that $\rho \propto \dfrac{1}{{\rm T}}$
Thus it is of the form $y = \dfrac{k}{x}$
The graph of it is a hyperbolic curve. Also resistivity and temperature also cannot be equal to zero or negative. Hence we get the curve only in the first quadrant.
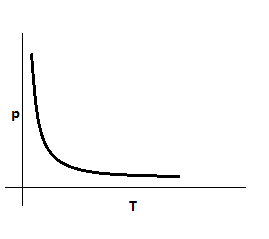
This the required graph of the question
Additional Information: Resistivity is a property of the material. It changes with the material and temperature. It is the electrical resistance of a conductor of unit cross-sectional area and unit length.
Semiconductors are materials which have a conductivity between conductors (generally metals) and nonconductors or insulators (such as most ceramics). Semiconductors can be pure elements, such as silicon or germanium, or compounds such as gallium arsenide or cadmium selenide. The resistivity of a semiconductor decreases with temperature.
Note: This graph is unique; it is for only semiconductors. The graph is different for other materials. It is a straight line with positive slope for metals and conductors as for conductors the resistivity increases linearly with increase in temperature.
Formula Used:
$\rho = \dfrac{m}{{n{e^2}\tau }}$
Complete step by step solution:
The resistivity is given by: $\rho = \dfrac{m}{{n{e^2}\tau }}$ where
$n = $ Number density of electrons
$\tau = $ Relaxation time
With the rise in temperature, the number density of electrons and holes (in case of semiconductors) increases, where τ remains constant. So, ρ (resistivity) decreases with increase in temperature.
From the above, we can infer that $\rho \propto \dfrac{1}{{\rm T}}$
Thus it is of the form $y = \dfrac{k}{x}$
The graph of it is a hyperbolic curve. Also resistivity and temperature also cannot be equal to zero or negative. Hence we get the curve only in the first quadrant.
This the required graph of the question
Additional Information: Resistivity is a property of the material. It changes with the material and temperature. It is the electrical resistance of a conductor of unit cross-sectional area and unit length.
Semiconductors are materials which have a conductivity between conductors (generally metals) and nonconductors or insulators (such as most ceramics). Semiconductors can be pure elements, such as silicon or germanium, or compounds such as gallium arsenide or cadmium selenide. The resistivity of a semiconductor decreases with temperature.
Note: This graph is unique; it is for only semiconductors. The graph is different for other materials. It is a straight line with positive slope for metals and conductors as for conductors the resistivity increases linearly with increase in temperature.
Recently Updated Pages
Master Class 12 Economics: Engaging Questions & Answers for Success
Master Class 12 Physics: Engaging Questions & Answers for Success
Master Class 12 English: Engaging Questions & Answers for Success
Master Class 12 Social Science: Engaging Questions & Answers for Success
Master Class 12 Maths: Engaging Questions & Answers for Success
Master Class 12 Business Studies: Engaging Questions & Answers for Success
Trending doubts
Which are the Top 10 Largest Countries of the World?
What are the major means of transport Explain each class 12 social science CBSE
Draw a labelled sketch of the human eye class 12 physics CBSE
Why cannot DNA pass through cell membranes class 12 biology CBSE
Differentiate between insitu conservation and exsitu class 12 biology CBSE
Draw a neat and well labeled diagram of TS of ovary class 12 biology CBSE