


How do you sketch the graph of \[y = {\left( {x + 2} \right)^2}\] and describe the transformation?
Answer
552.9k+ views
Hint: In this question we need to find the graph of \[y = {\left( {x + 2} \right)^2}\] and determine the transformation for it. To obtain the graph find the value of y for the different value of x and then mark the points on the graph to make the graph. Also to determine the transformation, determine the change in the transformation from parent function to given function.
Complete Step By Step solution:
In this question we have given a function that is \[y = {\left( {x + 2} \right)^2}\] and we need to sketch the graph and need to describe the transformation.
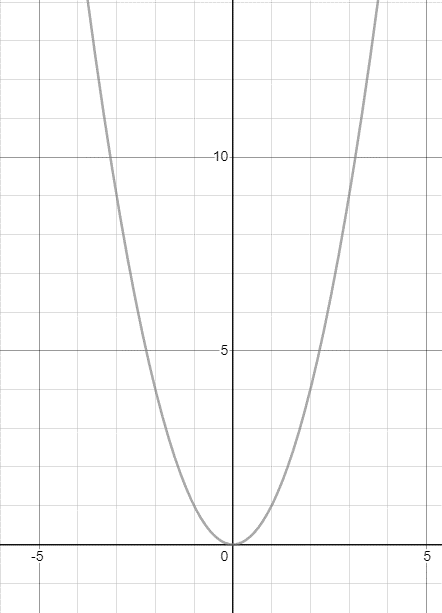
The above function is the quadratic function. The parent function for the quadratic function is \[y = {x^2}\].
Consider the table of values for this parent function is,
From the above table the graph for the parent function is shown below.
Now we will consider the table of values for this given function is,
From the above table the graph for the given function is shown in figure below.
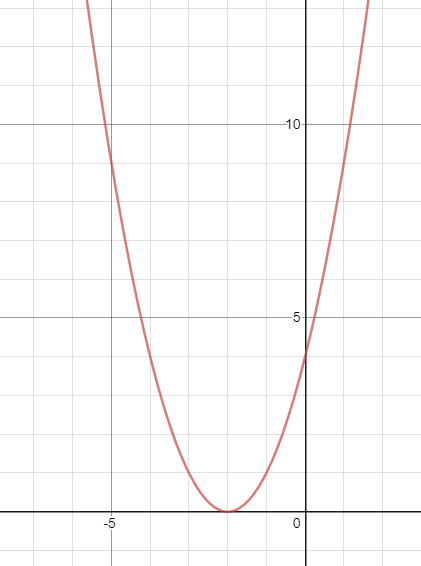
From the graph for the parent function and the graph for the given equation. It is concluded that the graph of \[{\left( {x + 2} \right)^2}\] is shifted \[2\] unit to the left from the parent function \[{x^2}\].
Note:
As we know that the quadratic equation is the equation that is of the standard from \[a{x^2} + bx + c\]. Here, a and b are the coefficients and c is the constant. In the general equation the highest power of the x is \[2\] so the equation is called quadratic. The range of all the quadratic functions lies from \[ - \infty \] to \[\infty \].
Complete Step By Step solution:
In this question we have given a function that is \[y = {\left( {x + 2} \right)^2}\] and we need to sketch the graph and need to describe the transformation.
The above function is the quadratic function. The parent function for the quadratic function is \[y = {x^2}\].
Consider the table of values for this parent function is,
| \[y\] | \[x\] |
| \[4\] | \[ - 2\] |
| \[9\] | \[ - 3\] |
| \[25\] | \[ - 5\] |
| \[49\] | \[ - 7\] |
| \[64\] | \[ - 8\] |
| \[4\] | \[2\] |
| \[9\] | \[3\] |
| \[25\] | \[5\] |
| \[49\] | \[7\] |
| \[64\] | \[8\] |
From the above table the graph for the parent function is shown below.
Now we will consider the table of values for this given function is,
| \[y = {\left( {x + 2} \right)^2}\] | \[x\] |
| \[0\] | \[ - 2\] |
| \[1\] | \[ - 3\] |
| \[9\] | \[ - 5\] |
| \[25\] | \[ - 7\] |
| \[36\] | \[ - 8\] |
| \[16\] | \[2\] |
| \[25\] | \[3\] |
| \[49\] | \[5\] |
| \[81\] | \[7\] |
| \[100\] | \[8\] |
From the above table the graph for the given function is shown in figure below.
From the graph for the parent function and the graph for the given equation. It is concluded that the graph of \[{\left( {x + 2} \right)^2}\] is shifted \[2\] unit to the left from the parent function \[{x^2}\].
Note:
As we know that the quadratic equation is the equation that is of the standard from \[a{x^2} + bx + c\]. Here, a and b are the coefficients and c is the constant. In the general equation the highest power of the x is \[2\] so the equation is called quadratic. The range of all the quadratic functions lies from \[ - \infty \] to \[\infty \].
Recently Updated Pages
Master Class 11 Computer Science: Engaging Questions & Answers for Success
Master Class 11 Business Studies: Engaging Questions & Answers for Success
Master Class 11 Economics: Engaging Questions & Answers for Success
Master Class 11 English: Engaging Questions & Answers for Success
Master Class 11 Maths: Engaging Questions & Answers for Success
Master Class 11 Biology: Engaging Questions & Answers for Success
Trending doubts
One Metric ton is equal to kg A 10000 B 1000 C 100 class 11 physics CBSE
There are 720 permutations of the digits 1 2 3 4 5 class 11 maths CBSE
Discuss the various forms of bacteria class 11 biology CBSE
Draw a diagram of a plant cell and label at least eight class 11 biology CBSE
State the laws of reflection of light
Explain zero factorial class 11 maths CBSE